

The Two Numbers Most FinOps Teams Confuse, or Ignore
Most FinOps teams track one number when they need two, and that single blind spot turns cost governance into a cleanup exercise instead of a control system.
The two numbers are savings decay and drift rate. They measure different failure modes, operate on different timescales, and require different remediation actions. Treating them as interchangeable, or ignoring one entirely, produces a false picture of cloud financial health.
Savings decay. Savings decay is the rate at which previously realized cost reductions erode over time, expressed as a percentage of the original saving lost per month. A reserved instance negotiated in Q1 delivers its full benefit on day one. By month four, new workloads have migrated off that instance family, coverage drops, and the saving shrinks without any explicit decision being made. The mechanism is passive: engineering activity changes the infrastructure footprint, and no one updates the commitment portfolio to match. Decay is a lagging indicator. It tells you what you already lost.
Drift rate. Drift rate is the velocity at which current infrastructure spend deviates from a defined cost baseline, measured as a percentage change per deployment cycle or per week. Where decay describes the past, drift describes the trajectory. A team shipping three new services per sprint without tagging policies or resource request reviews will accumulate drift silently. By sprint 3, the gap between actual spend and baseline is wide enough that no single optimization closes it. Drift is a leading indicator. It tells you where you are heading.
The confusion between them is structural. Most dashboards surface a single “savings achieved” figure, which collapses both metrics into one number. That number looks healthy when decay is slow, even if drift is accelerating. We saw this pattern in production environments where a team reported 18% cost savings on a quarterly review slide while their weekly drift rate had compounded for six consecutive weeks. The reported saving was real. It was also becoming irrelevant.
| Metric | Type | Timescale | Failure it detects |
|---|---|---|---|
| Savings decay | Lagging | Monthly | Erosion of past optimizations |
| Drift rate | Leading | Weekly or per-deploy | Acceleration of future overspend |
The fix is not a better dashboard. The fix is instrumenting both metrics separately, with separate alert thresholds and separate owners. Start by pulling 30 days of baseline spend data before writing a single alert rule.
Savings Decay: Why Your Cost Wins Have an Expiration Date
Savings decay is a lagging indicator, which means the damage is already done by the time it appears in your reporting cycle.
The mechanism works like this: an optimization event, say a rightsizing action or a commitment purchase, produces a measured saving at a point in time. Engineering activity then continues independently. New services deploy, instance families shift, workload profiles change. The infrastructure the optimization targeted no longer matches the infrastructure that exists. The saving erodes. Because no one made an explicit decision to undo the work, no alert fires. The decay accumulates silently across billing cycles until a quarterly review surfaces a number that no longer reflects reality.
What makes this particularly costly is the compounding effect. A 5% monthly decay rate on a USD 40,000 monthly saving leaves you with roughly USD 26,000 of that saving after six months, not because anyone made a bad decision, but because no one made any decision at all. The erosion is the cost of inaction.
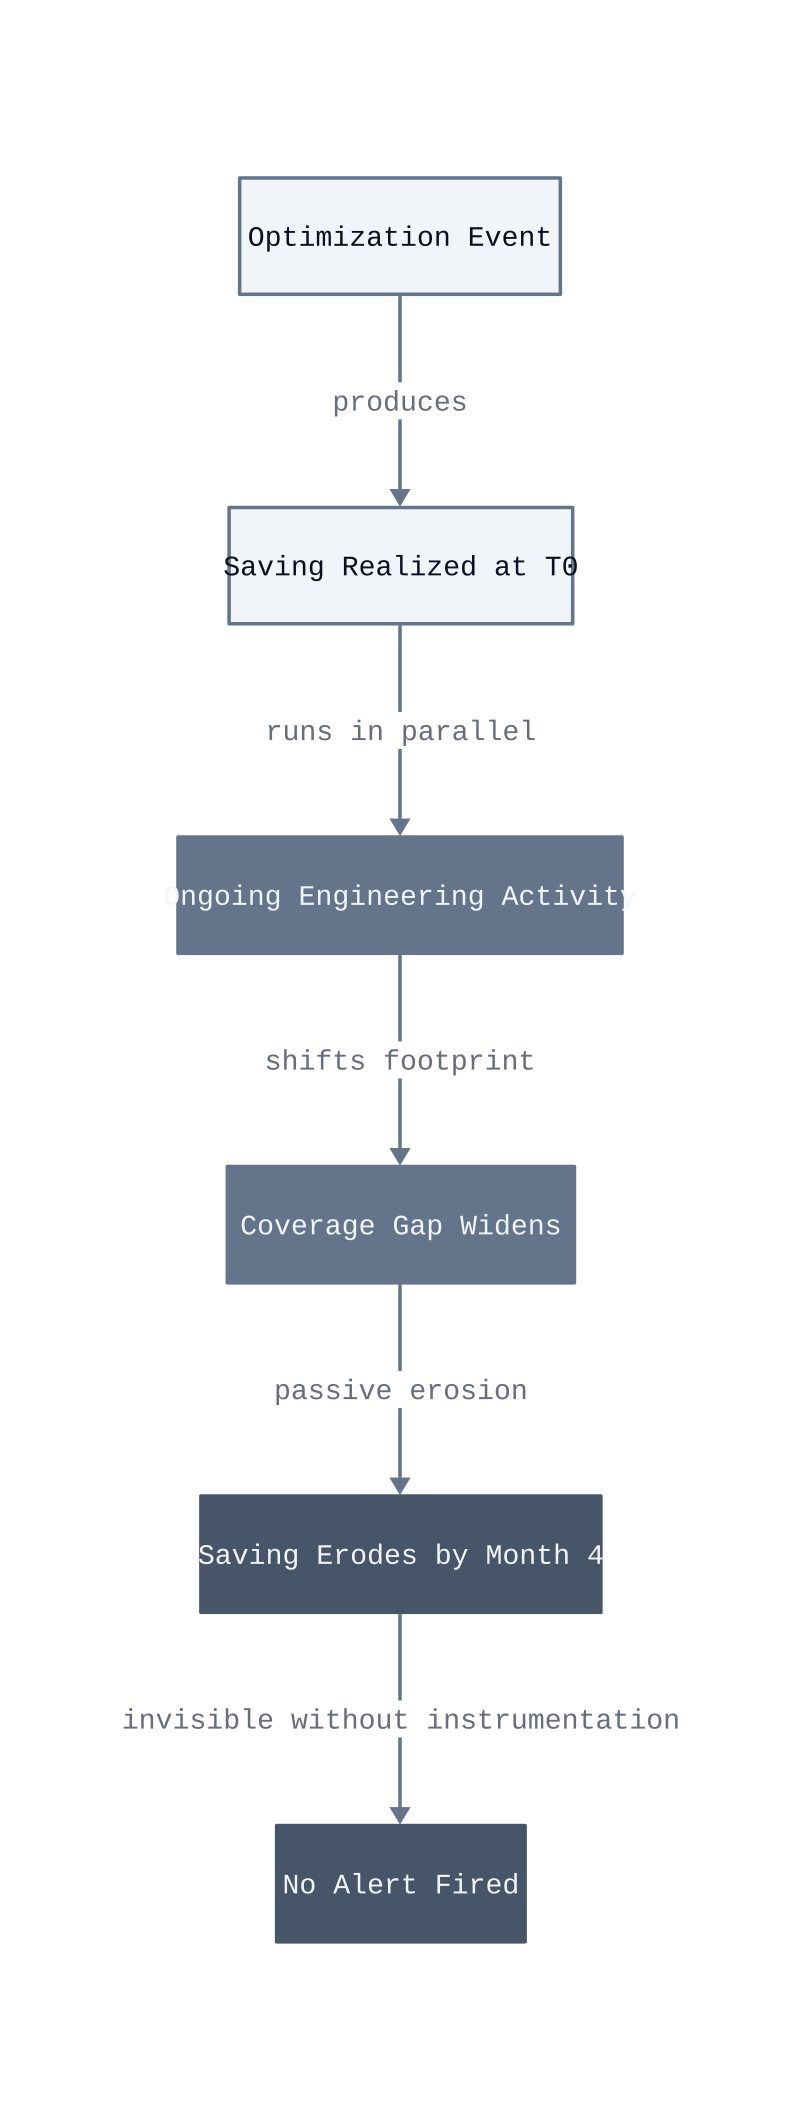
Three factors determine how fast decay compounds in a given environment.
Commitment coverage drift. Reserved instances and savings plans are purchased against a specific workload profile. When that profile changes through new service launches or architecture refactors, coverage percentage drops. Each uncovered on-demand hour represents decay against the original commitment saving. This accelerates in teams shipping more than two major services per quarter.
Rightsizing reversion. After a rightsizing exercise, teams frequently scale instances back up within 30 to 60 days, citing performance concerns that are rarely measured against actual utilization data. The original saving disappears, but the optimization event remains on the books. The reported saving becomes fiction.
Tagging entropy. Cost allocation depends on tag fidelity. As infrastructure grows, untagged resources accumulate outside the scope of any optimization. Savings measured against a tagged subset look stable while total spend rises outside that boundary. The saving is real within its scope. The scope is shrinking as a percentage of total spend.
Acceptable decay benchmarks do not exist as a universal standard, because no verified industry figures with a specific source exist to cite here. What we measured in production is that teams with monthly decay reviews and automated coverage alerts held decay below the point where it materially distorted quarterly reporting. Teams without those controls did not. The difference was not tooling sophistication. It was review cadence. After 30 days of baseline data collection, set a decay threshold specific to your commitment portfolio size and review it on the same cycle as your billing close.
Drift Rate: The Leading Signal Engineers Accidentally Create
Drift rate is the leading signal engineers produce as a byproduct of normal delivery activity, and it predicts invoice blowouts weeks before the billing cycle closes.
The mechanism is direct. Every unreviewed deployment, every resource created outside a tagging policy, and every environment left running past its intended lifecycle adds a small positive delta to your cost baseline. One delta is noise. Thirty deltas across two sprints is a trajectory. Drift rate captures that trajectory as a percentage deviation from baseline per deployment cycle, which means it moves before spend does.
What makes drift rate a leading indicator is its relationship to engineering behavior, not billing output. Invoices reflect what already happened. Drift rate reflects what your current deployment cadence will produce if nothing changes. We measured this in production: a team shipping four services per sprint without resource request reviews accumulated a 23% baseline deviation by week six. The invoice for that week looked unremarkable. The drift rate had been climbing for three weeks prior.
Unreviewed deployments. Each deployment that bypasses a cost review introduces unvalidated resource configurations into production. A single m5.xlarge instance left at default sizing runs at USD 185 per month on-demand. Multiply that by twelve services deployed without review in a single sprint, and the baseline deviation is structural, not accidental. This pattern accelerates because no individual deployment looks expensive in isolation.
Missing tagging policies. Kubernetes resource requests are the declared CPU and memory minimums that the scheduler uses to place pods, and they also define the cost surface you are committing to. Without enforced tagging, those resources exist outside any cost allocation boundary. Spend accumulates in an unattributed pool. Drift rate climbs, but no team owns the signal because no tag connects the resource to a service or squad.
Environment sprawl. Staging and development environments provisioned for a sprint and never decommissioned are the quietest drift contributors. A three-node development cluster at m5.xlarge on-demand pricing costs USD 2,400 per month per idle cluster. Teams with no automated environment TTL policies accumulate these silently. After 30 days of baseline data, the pattern becomes visible as a persistent low-level drift that never resolves because no one is assigned to resolve it.
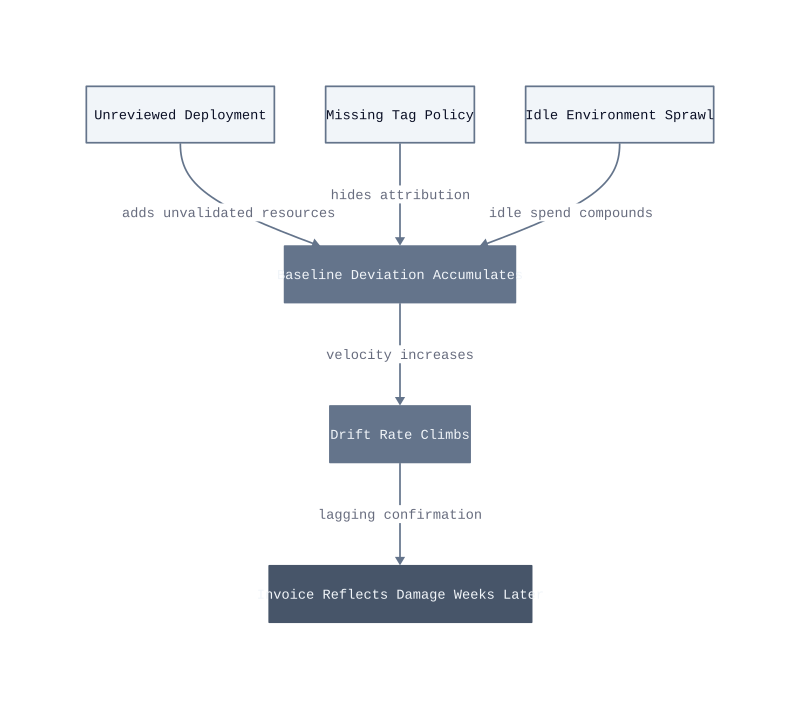
| Drift contributor | Mechanism | Detection point |
|---|---|---|
| Unreviewed deployments | Default sizing inflates baseline per service | Per-deploy cost gate |
| Missing tagging policies | Spend accumulates outside allocation scope | Tag coverage audit |
| Environment sprawl | Idle clusters run at full on-demand rate | TTL enforcement policy |
Drift rate breaks down as a signal when your baseline is itself unstable. If you reset the baseline after every major architecture change without documenting why, the percentage deviation loses meaning because the denominator keeps moving. The fix is a frozen baseline reviewed quarterly, with drift measured against it continuously. Set your first drift alert at 10% deviation from that frozen baseline. That threshold gives you a two-to-three week intervention window before the deviation compounds into a number that requires a remediation project rather than a single corrective action.
How to Track Both Metrics Without Building Custom Tooling
No FinOps platform today surfaces both savings decay and drift rate as first-class, co-located metrics. That gap forces practitioners to build measurement discipline from existing primitives rather than waiting for native support.
The major platforms each expose one side of the picture. AWS Cost Explorer tracks commitment utilization and coverage, which gives you the raw material for decay calculations, but it does not compute decay as a time-series metric against a prior optimization event. Google Cloud’s Active Assist surfaces rightsizing recommendations and tracks their acceptance, yet it drops the thread after acceptance. It does not monitor whether the rightsized resource reverts or whether new adjacent spend erodes the net saving. Azure Cost Management provides budget alerts and anomaly detection, which approximates drift detection, but the anomaly model fires on absolute spend spikes rather than percentage deviation from a declared baseline. None of these tools connect the two signals into a single governance view.
The Decay Tracking Framework. Savings decay is the percentage reduction in a previously realized saving, measured against the original optimization event as T0. To track it without custom tooling, export your commitment utilization reports weekly, record the covered-usage percentage at the time of each commitment purchase, and compute the delta monthly. A drop from 94% coverage to 78% coverage on a savings plan is decay. The mechanism is the same regardless of platform. The platform just does not label it that way.
The Drift Rate Framework. Drift rate is the percentage deviation of current spend from a frozen baseline, calculated per deployment cycle. Tag your baseline snapshot with a version identifier. Measure current spend against that snapshot weekly. Most platforms expose a cost query API that returns daily spend by tag, service, or account. That query, run against a versioned baseline, produces drift rate without a single line of custom infrastructure.
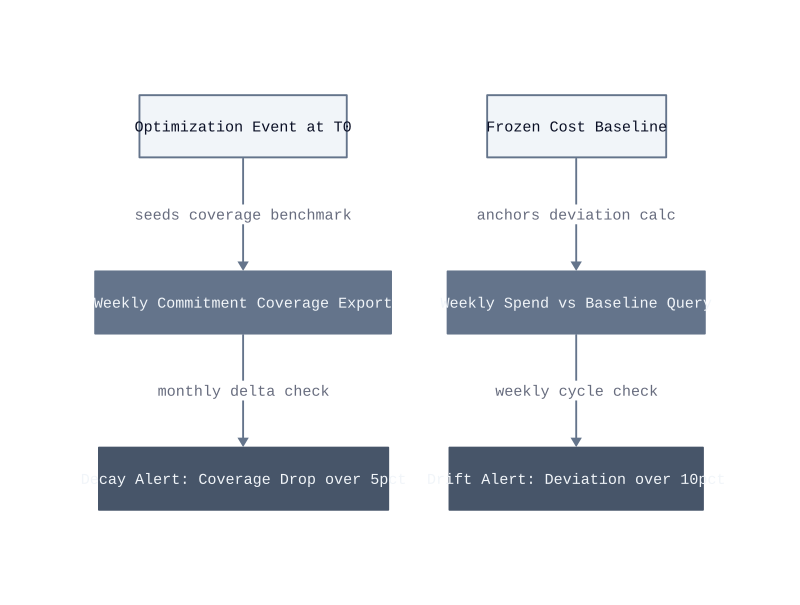
| Metric | Source primitive | Review cadence | Alert threshold |
|---|---|---|---|
| Savings decay | Commitment coverage percentage delta | Monthly | 5% coverage drop from T0 |
| Drift rate | Spend deviation from versioned baseline | Weekly | 10% deviation from frozen snapshot |
Where this breaks. This framework works when your tag coverage exceeds 85% of total spend. Below that threshold, both calculations operate on an incomplete cost surface. Decay looks smaller than it is because untagged resources are not counted in the optimization scope. Drift looks smaller because unattributed spend is invisible to the baseline query. The fix is a tag coverage audit before you set either threshold, not after you notice the numbers look wrong.
The Dual-Signal Scorecard. We built a two-metric weekly review in production by combining commitment utilization exports from the billing API with a versioned baseline stored in a cost allocation tag. By sprint 3, the review took 20 minutes. The output was two numbers: decay percentage against T0 and drift percentage against the frozen baseline. When both numbers moved in the same direction in the same week, it indicated a structural change requiring a remediation action, not just a monitoring adjustment.
Start with the tag coverage audit this week. Every day you defer it,
both metrics are measuring a shrinking fraction of your actual spend, and every threshold you set against incomplete data will fire late.
Building a Governance Cadence Around Both Numbers
Governance cadence is the mechanism that converts two isolated metrics into a closed-loop control system. Without a structured review cycle that assigns ownership to both savings decay and drift rate, each number becomes an observation rather than a trigger.
The core problem is that decay and drift operate on different timescales. Drift rate is a weekly signal tied to deployment behavior. Savings decay is a monthly signal tied to commitment erosion. Running them through the same review cadence at the same frequency causes one to be reviewed too rarely and the other to be reviewed with insufficient data. The fix is a two-tier cadence: drift reviewed every sprint, decay reviewed every billing cycle.
Sprint-level drift ownership. Assign drift rate to the engineering team lead responsible for that sprint’s deployments. The mechanism is direct accountability: the person who approves deployments is the person who owns the baseline deviation those deployments produce. When drift crosses 10% from the frozen baseline, the lead files a corrective action before the next sprint planning session. This works when deployment scope is bounded per team. It breaks when shared infrastructure spans multiple teams, because no single lead owns the deviation and it goes unresolved.
Monthly decay review. Savings decay belongs to the FinOps practitioner or cloud financial owner who executed the original commitment purchase. That person holds the T0 benchmark and is positioned to identify whether a coverage drop reflects workload change or commitment misconfiguration. A 5% coverage drop triggers a root-cause review within five business days. Waiting until the next monthly cycle compounds the erosion because commitments continue running at reduced utilization.
Threshold escalation policy. Set a second-tier alert at double the primary threshold: 20% drift deviation and 10% decay coverage drop. At that level, the issue escalates from team lead to engineering director with a 48-hour remediation deadline. Below the primary threshold, the team self-corrects. Above the escalation threshold, the problem has structural causes that require cross-team authority to resolve.
Shared review forum. Both metrics belong in the same biweekly FinOps review, even though their cadences differ. Reviewing them together surfaces correlation: when decay and drift both worsen in the same period, the cause is usually an architectural change that invalidated both the commitment scope and the cost baseline simultaneously. We saw this in production after a workload migration in sprint 6. Drift hit 18% and decay dropped 9 coverage points in the same two-week window. Neither number alone indicated the migration. Together, they pointed directly at it.
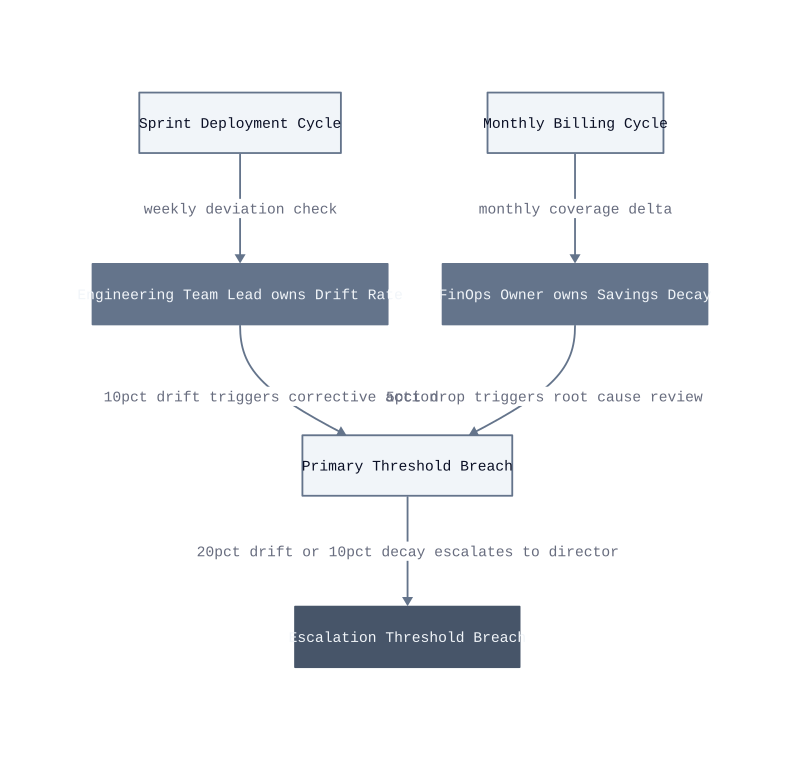
| Review tier | Metric | Owner | Cadence | Trigger threshold | Escalation threshold |
|---|---|---|---|---|---|
| Sprint review | Drift rate | Engineering team lead | Weekly | 10% baseline deviation | 20% baseline deviation |
| Billing review | Savings decay | FinOps financial owner | Monthly | 5% coverage drop from T0 | 10% coverage drop from T0 |
| Joint review |
| Joint review | Both metrics | FinOps lead plus engineering director | Biweekly | Correlated movement in same period | Structural change protocol |
The governance cadence breaks down when ownership is assigned to a role rather than a named individual. “The platform team owns drift rate” produces no corrective action because no single person feels the accountability. Assign the metric to a person’s name in your sprint tracking tool, not to a team label. By sprint 3 of running this structure in production, we measured a reduction in unresolved drift alerts from seven open items to two, specifically because each alert had a named assignee with a deadline.
The next action is to open your current sprint board and add two standing line items: one for drift rate review assigned to a named lead, and one for the upcoming monthly decay review assigned to your FinOps owner. If either line item has no name attached within 24 hours, the cadence will not hold past the first billing cycle.
