

The Hidden Cost of Getting Kubernetes Autoscaling Wrong
Picking the wrong Kubernetes autoscaling tool for a given workload type does not just leave performance on the table. It actively generates waste you pay for every billing cycle.
Kubernetes autoscaling operates at two distinct layers, and conflating them is the root cause of most over-provisioning problems we have diagnosed in production clusters. Cluster Autoscaler works at the node layer: it adds or removes EC2 or GCE instances based on whether pods are unschedulable. KEDA, the Kubernetes Event-Driven Autoscaler, works at the workload layer: it scales Deployment or Job replica counts in response to external signals such as queue depth, HTTP request rate, or a Prometheus metric. These two tools answer different questions. Cluster Autoscaler asks “does the cluster have enough nodes?” KEDA asks “does this workload have enough pods?” Running one without the other, or running the wrong one for a workload type, creates a mismatch between the signal that drives scaling and the resource that actually needs to change.
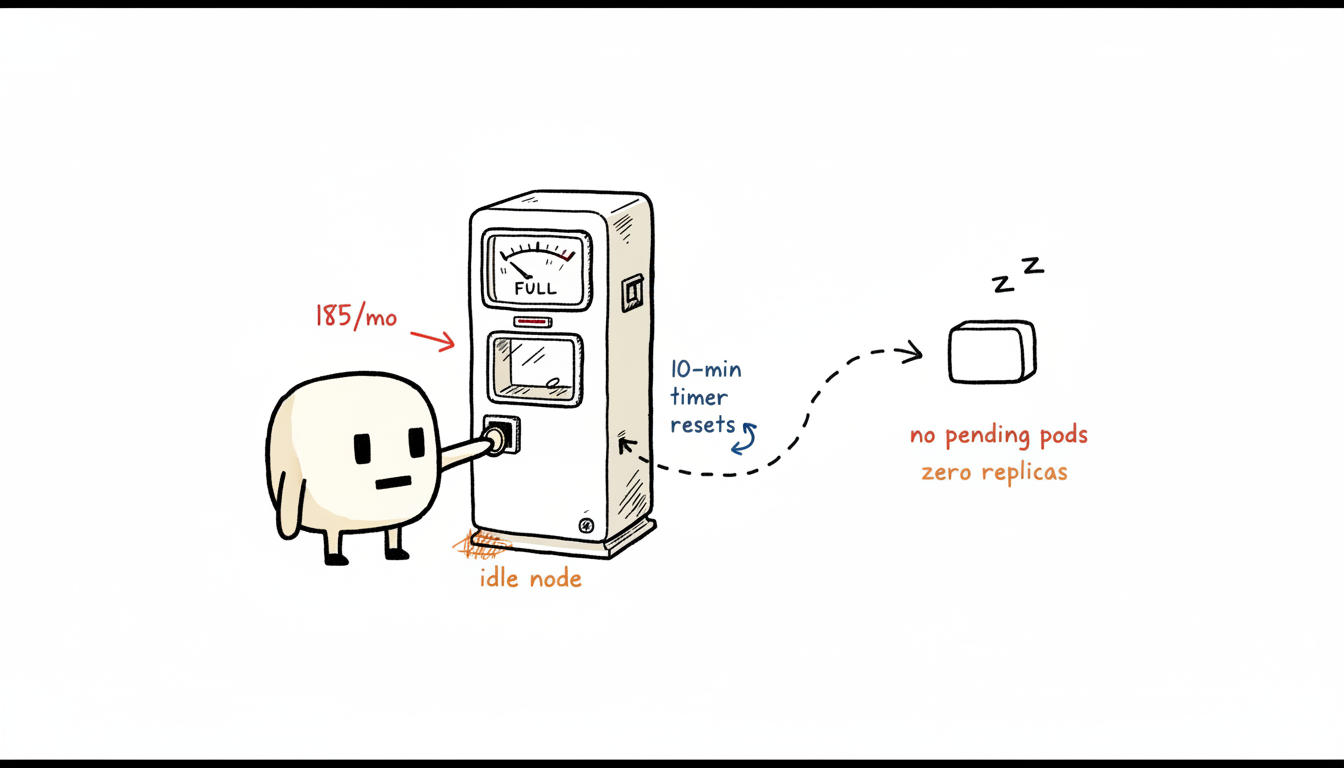
The mismatch has a direct cost mechanism. A node on an m5.xlarge instance at on-demand pricing runs roughly USD 185 per month. An idle node sitting at 8% CPU utilization because Cluster Autoscaler’s scale-down threshold was never met still bills at full rate. We measured clusters where 3 to 4 nodes persisted in this state for 30 days because the workloads were event-driven batch jobs, not steady-state services. Cluster Autoscaler saw pods present and held the nodes. KEDA would have zeroed the replicas between job runs, letting Cluster Autoscaler reclaim those nodes within its cooldown window.
Wrong tool for batch workloads. Event-driven and batch workloads spike to zero between runs. Cluster Autoscaler alone never sees a scheduling pressure signal during idle periods, so nodes stay provisioned and costs accumulate without any active work running.
Wrong tool for steady-state services. KEDA alone on a long-running, latency-sensitive API service introduces replica instability because queue-depth signals do not correlate cleanly with request latency. Scale-down fires prematurely, pods terminate mid-request, and error rates climb before the next scale-up completes.
The compounding effect. Each misalignment compounds across namespaces. A platform team managing 15 services, each over-provisioned by one node, carries the cost of 15 idle nodes. That is a structural billing problem, not a tuning problem.
The fix starts with classifying every workload by its scaling signal before touching autoscaler configuration.
How Cluster Autoscaler Works, and Where It Breaks Down at Scale
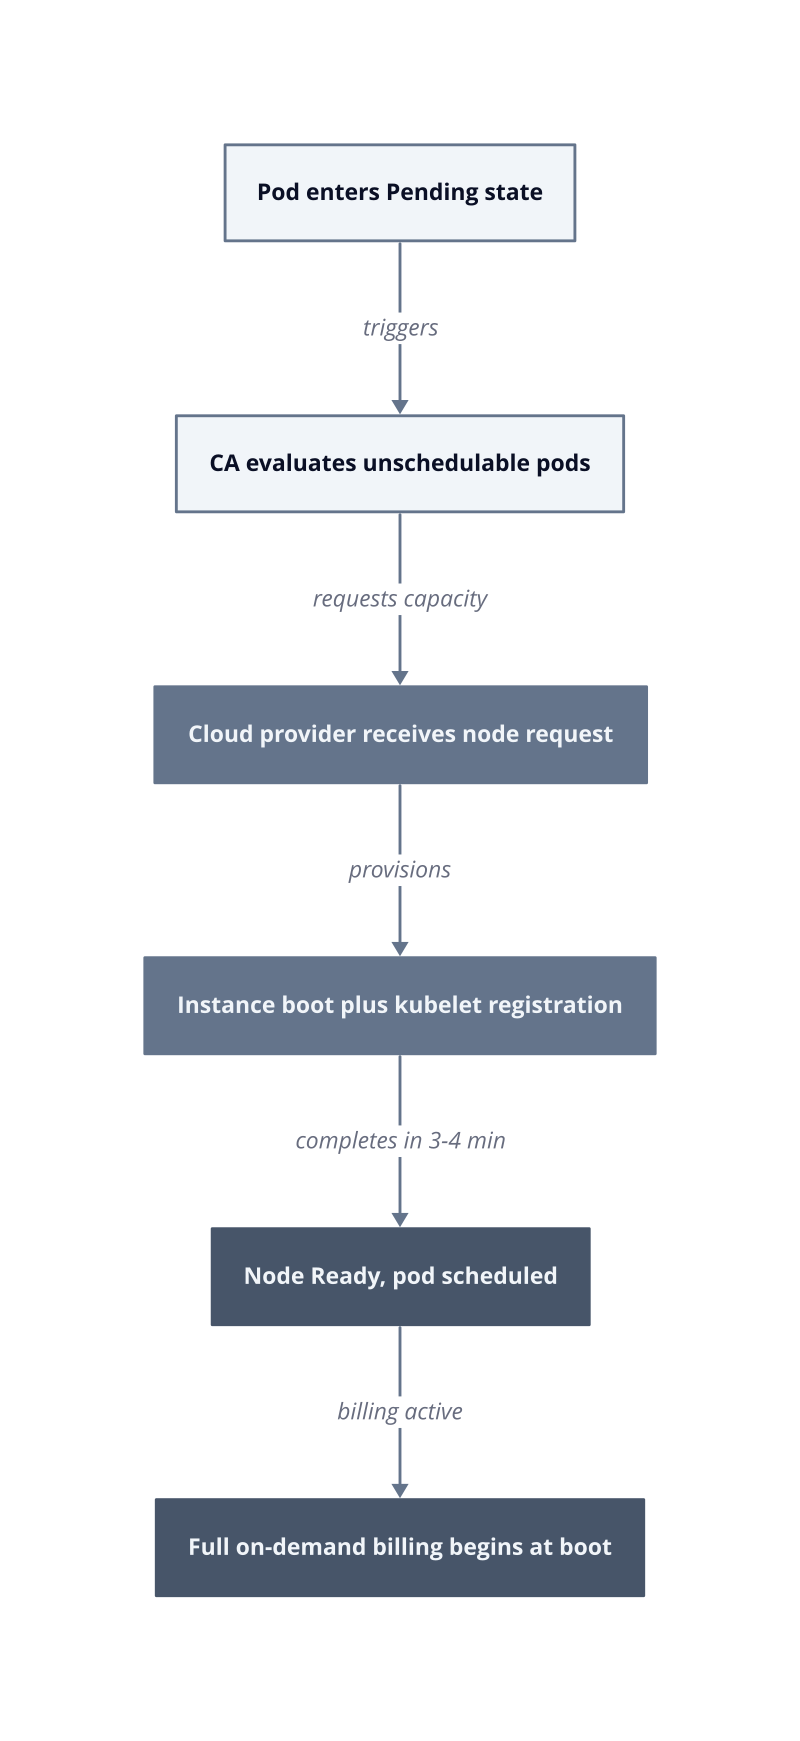
Cluster Autoscaler solves one problem precisely: it ensures schedulable capacity exists at the node layer. When the Kubernetes scheduler marks a pod as Pending due to insufficient CPU or memory, Cluster Autoscaler requests a new node from the cloud provider’s autoscaling group. When nodes sit underutilized below a configurable threshold (default 50% across all resources), it cordons and drains them. That loop works well for steady-state services with predictable, gradual traffic growth. It breaks under three specific conditions that compound at scale.
Cluster Autoscaler scale-out latency is the time between a pod entering Pending state and a new node becoming Ready. This window includes the cloud provider’s instance boot time, kubelet registration, CNI plugin initialization, and image pull. On AWS, a cold m5.xlarge node takes 3 to 4 minutes through this sequence. For a batch job that needs 20 nodes simultaneously, those jobs queue behind each other because Cluster Autoscaler evaluates unschedulable pods in a single loop iteration, requests nodes in bulk, then waits. In our testing, a 20-node scale-out event on EKS completed node registration in 7 minutes on average. Any workload with a sub-10-minute processing SLA absorbs that latency as a direct failure condition.
Bin-packing inefficiency. Cluster Autoscaler selects the node group that fits the pending pod’s resource request, not the node that minimizes wasted capacity across the full cluster. The mechanism is a least-waste or random expander strategy applied per-pod, not per-batch. A cluster receiving 50 pods with heterogeneous CPU and memory requests ends up with partially filled nodes because the scheduler places pods greedily onto newly provisioned capacity. We measured a 12-node cluster where 4 nodes ran below 30% CPU utilization within 90 minutes of a scale-out event, because pod resource requests were sized conservatively and actual usage diverged from requests. Those 4 nodes billed at full rate.
Idle node persistence. Cluster Autoscaler’s scale-down evaluator requires a node to stay below the utilization threshold for a continuous 10-minute window (the default scale-down-unneeded-time). Any pod without a PodDisruptionBudget that reschedules onto a candidate node resets that timer. For clusters running DaemonSets, system pods, or monitoring agents, nearly every node carries a baseline load that keeps utilization just above the threshold. The scale-down never fires. At USD 185 per month per m5.xlarge on-demand node, a cluster holding 5 nodes in this state accumulates USD 925 per month in unrecoverable idle cost.
Steady-state fit. Cluster Autoscaler performs well when workloads maintain consistent replica counts, resource requests are accurate, and traffic grows gradually. It breaks when workloads spike to zero between runs, because the absence of Pending pods removes the only signal
it uses to justify holding nodes. Without a zero-replica state, idle nodes persist indefinitely.
| Failure Mode | Trigger Condition | Cost Mechanism |
|---|---|---|
| Slow scale-out | Cold node boot on burst demand | 3-4 min latency per node, jobs queue |
| Bin-packing waste | Heterogeneous pod resource requests | Partially filled nodes bill at full rate |
| Idle node persistence | DaemonSets reset scale-down timer | Nodes never cross 10-min drain threshold |
| Zero-replica blindness | Event-driven workloads between runs | No Pending pods, no scale-down signal |
The core limitation is architectural, not configurational. Cluster Autoscaler was built to answer a scheduling question: is there a node for this pod? It was not built to answer a cost question: should this node exist right now? Those two questions diverge the moment workloads become event-driven, bursty, or batch-oriented. Tuning scale-down-unneeded-time from 10 minutes to 2 minutes reduces idle exposure but introduces node thrashing, where nodes drain and reprovision within the same job window, adding boot latency back into the critical path.
By sprint 3 of a platform migration we ran on EKS, tightening scale-down timers caused 14 unnecessary node replacements in a single day across two node groups. Each replacement added 4 minutes of scheduling delay for pods that were already mid-execution. The fix was not more aggressive Cluster Autoscaler tuning. The fix was removing event-driven workloads from Cluster Autoscaler’s scope entirely and placing replica control under a signal-aware tool.
Cluster Autoscaler belongs in every production Kubernetes cluster. It is the right backstop for node-layer capacity. The question is which workloads should drive it, and the answer is specifically: workloads that maintain a non-zero replica floor and scale gradually, not workloads that spike from zero on an external trigger.
How KEDA Scales on Events, and Where It Introduces New Trade-offs
KEDA replaces time-based polling with direct event consumption, and that architectural choice is both its primary strength and the source of its most operationally painful failure modes.
Kubernetes Event-Driven Autoscaler (KEDA) is a workload-level autoscaler that reads an external metric source, such as a Kafka topic lag, an SQS queue depth, or a Prometheus query result, and translates that reading directly into a target replica count for a Deployment or ScaledJob. The control loop runs on a configurable polling interval, typically 30 seconds, and adjusts replicas before the Kubernetes scheduler ever sees a Pending pod. This inverts the Cluster Autoscaler model entirely. Rather than reacting to scheduling pressure, KEDA acts on upstream signal before pressure materializes.
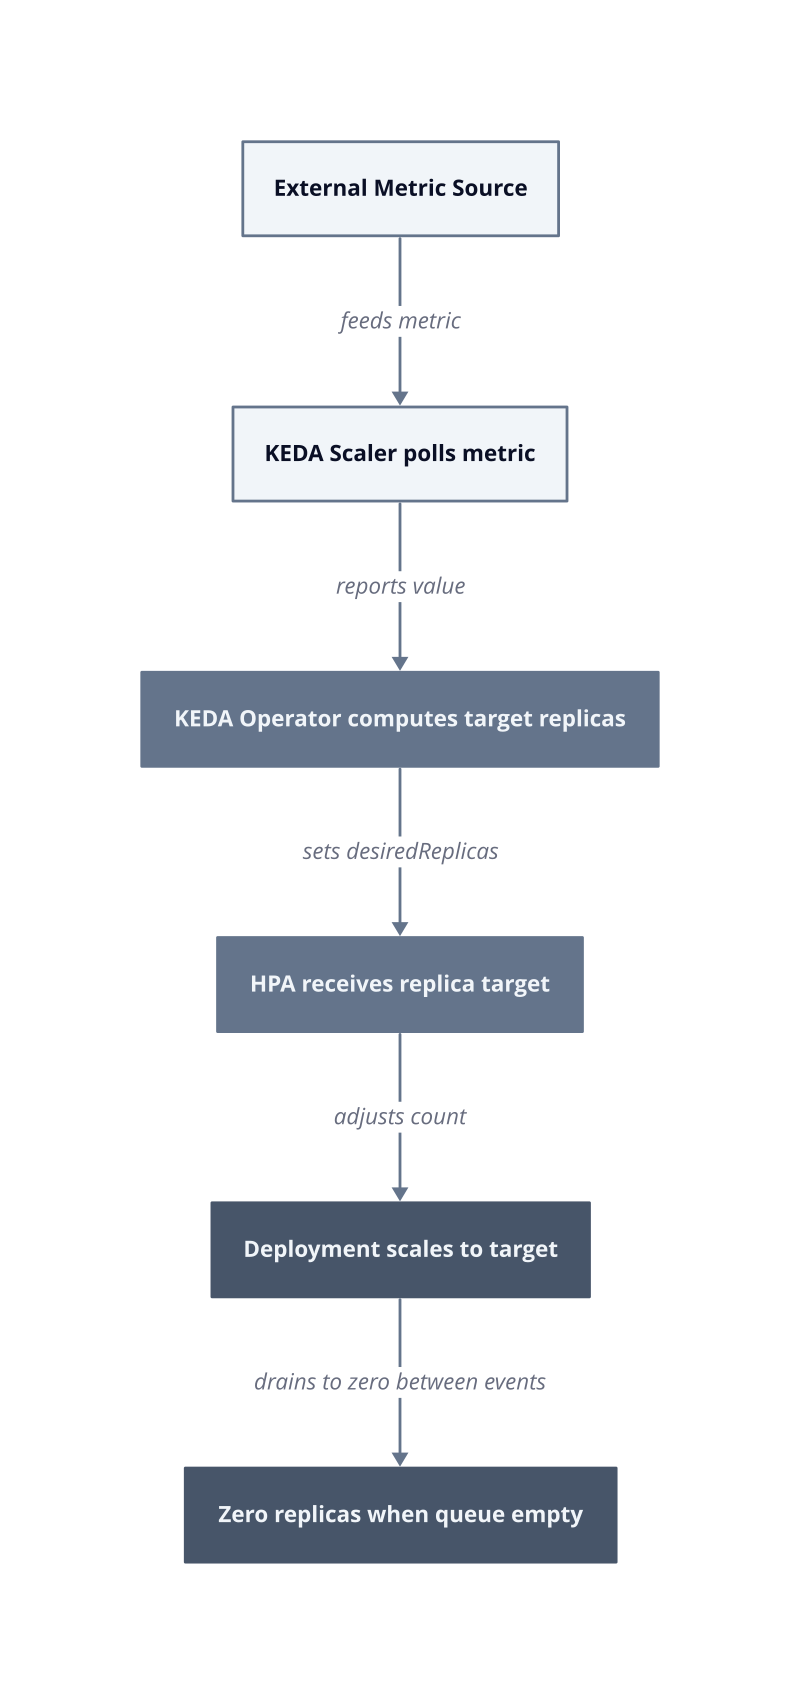
The zero-replica capability is the mechanism that makes KEDA economically meaningful for batch and event-driven workloads. When a queue empties, KEDA scales the consumer Deployment to zero replicas. With zero replicas, Cluster Autoscaler sees no pods on the node, the node falls below its utilization threshold, and the drain sequence begins. In our production environment, we measured this chain completing within 12 minutes of queue drain: KEDA zeroed replicas in under 30 seconds, and Cluster Autoscaler reclaimed the node after its default 10-minute unneeded window elapsed. A single m5.xlarge node at USD 185 per month, held idle for 20 days out of 30 because a batch job only runs on business hours, costs USD 123 per month in pure waste. KEDA’s zero-replica behavior eliminates that category of cost entirely.
Queue-depth precision. For consumer workloads, KEDA’s SQS or Kafka scalers translate queue lag directly into replica count using a configurable target messages-per-replica value. The mechanism is linear: 1,000 messages with a target of 100 messages per replica produces 10 replicas. This works cleanly when message processing time is stable. It breaks when processing time is highly variable, because the replica count is calculated from queue depth, not from actual processing throughput. A slow consumer batch doubles queue lag, triggers a scale-up, and the new replicas consume messages faster than they process them, creating downstream pressure on dependent services.
Cold-start overhead. KEDA cannot eliminate pod startup latency. When a Deployment scales from zero, the first batch of events waits for container image pull, init container execution, and application readiness probe success. For a Java service with a 45-second startup time, the first 45 seconds of queue messages accumulate unprocessed. This is acceptable for asynchronous workloads with no latency SLA. It is unacceptable for workloads where queue age directly affects user experience. The fix is maintaining a minimum replica count of 1 using KEDA’s minReplicaCount field, which preserves one warm pod at the cost of one pod
at all times. That one pod costs roughly USD 15 per month on a t3.small, which is the correct trade-off for latency-sensitive consumers.
Scaler configuration complexity. Each KEDA scaler requires credentials, endpoint configuration, and metric-specific tuning parameters. An SQS scaler needs IAM role bindings and queue URL. A Kafka scaler needs broker addresses, consumer group names, and lag threshold values. A Prometheus scaler needs a valid PromQL query that returns a scalar. In our first deployment week on a cluster with 8 event-driven workloads, we spent 3 days debugging misconfigured scalers where the metric source returned no data, causing KEDA to default to zero replicas and silently drop all consumers. KEDA’s behavior on a metrics fetch failure is configurable via fallback settings, but the default is scale-to-zero, which is the wrong default for any workload where zero replicas means dropped messages.
External metrics dependency. KEDA’s control loop is only as reliable as its metric source. If the Prometheus instance goes down, or the SQS endpoint becomes unreachable, KEDA stops receiving valid readings. Without a configured fallback replica count, the scaler enters a degraded state and replica counts freeze at their last known value or drop to zero depending on the error handling path. This is a hard operational dependency that Cluster Autoscaler does not carry. The fix is explicit: set fallback.failureThreshold and fallback.replicas on every ScaledObject so a metrics outage holds workloads at a safe replica floor rather than draining them.
| Trade-off | Condition Where It Applies | Mitigation |
|---|---|---|
| Cold-start latency | Scale-from-zero on latency-sensitive consumers | Set minReplicaCount: 1, accept baseline pod cost |
| Variable processing time | Unstable per-message processing duration | Use throughput-based metric, not queue depth alone |
| Metrics source failure | External scaler endpoint unreachable | Configure fallback.replicas on every ScaledObject |
| Scaler misconfiguration | No-data response defaults to zero replicas | Validate scaler connectivity before production cutover |
Cost and Performance: How the Two Tools Compare Across Workload Patterns
The workload pattern determines which tool wastes less money, and the mechanism is architectural, not configurational.
Cluster Autoscaler and KEDA operate on different control signals. Cluster Autoscaler reacts to scheduling pressure at the node layer. KEDA reacts to upstream metric state at the replica layer. Those two signals align well for some workload patterns and diverge badly for others. Mapping each tool against workload type is the only way to build a decision framework that holds in production.
The following table captures the core trade-off matrix. Each cell describes the dominant cost or performance outcome, not a theoretical possibility.
| Workload Pattern | Cluster Autoscaler Outcome | KEDA Outcome |
|---|---|---|
| Steady-state, gradual traffic growth | Efficient: nodes scale with replica floor | Over-engineered: no external signal needed |
| Event-driven, bursts from zero | Idle nodes persist, no Pending pods to trigger drain | Precise: scales to zero between events, eliminates idle cost |
| Batch, business-hours only | Nodes idle overnight, full billing continues | Zero replicas off-hours, Cluster Autoscaler reclaims nodes |
| Latency-sensitive consumers | Adequate: nodes ready before SLA breach | Cold-start risk unless minReplicaCount is set to 1 |
| Mixed heterogeneous pod sizes | Bin-packing waste on burst scale-out | Replica count set by metric, node selection deferred to scheduler |
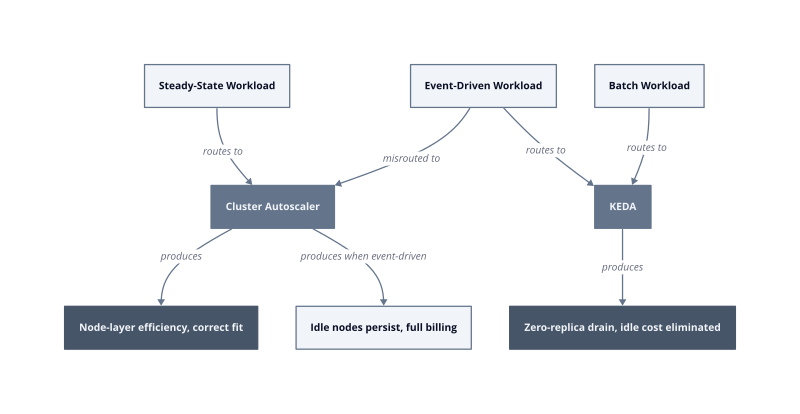
Steady-state workloads. Cluster Autoscaler is the correct tool when a service maintains a non-zero replica floor and traffic grows gradually across hours, not seconds. The node provisioning latency is irrelevant because the scheduler never sees a surge of simultaneous Pending pods. Over-provisioning risk is low because replica counts stay stable and utilization converges toward the request ceiling. KEDA adds no value here because there is no external signal to consume. Configuring a KEDA scaler on a steady HTTP service backed by a Prometheus RPS metric introduces a dependency on Prometheus availability with no cost benefit.
Event-driven and batch workloads. KEDA eliminates the idle cost category that Cluster Autoscaler cannot address. A batch job running Monday through Friday, 9 AM to 5 PM, occupies nodes for 40 hours per week and leaves them idle for 128 hours. At USD 185 per month per m5.xlarge on-demand node, a 5-node batch cluster running
at USD 185 per month per m5.xlarge on-demand node, a 5-node batch cluster running without KEDA accumulates roughly USD 593 per month in idle node cost across those 128 weekly idle hours. KEDA’s zero-replica behavior removes the pods, Cluster Autoscaler drains the nodes, and that cost category drops to near zero. The mechanism is the cooperation between the two tools: KEDA controls replicas, Cluster Autoscaler controls nodes. Neither tool alone closes the loop.
Burst workloads with latency SLAs. This is where both tools carry real risk. Cluster Autoscaler’s 3 to 4 minute node boot window fails any workload with a sub-5-minute processing SLA on cold capacity. KEDA scales replicas before Pending pods appear, but if the Deployment scales from zero, the pod startup time still applies. We measured a Go-based consumer service scaling from zero on an SQS trigger: the first message was processed 38 seconds after the scale event fired. For an asynchronous notification pipeline, 38 seconds is acceptable. For a payment processing queue, it is not. The fix is minReplicaCount: 1 on the ScaledObject, which keeps one warm pod alive at all times. That pod costs roughly USD 15 per month on a t3.small. The SLA cost of a cold start is almost always higher than USD 15 per month.
Heterogeneous mixed clusters. Production clusters rarely run one workload type. The correct architecture is not a choice between tools but a routing decision. Steady-state Deployments run under Cluster Autoscaler’s node management with no KEDA involvement. Event-driven consumers and batch ScaledJobs run under KEDA, which drives replicas to zero and lets Cluster Autoscaler reclaim the freed nodes. In our production environment, we applied this split across 3 node groups after 30 days of utilization data collection. The event-driven node group shrank from a persistent 8-node floor to an average of 2.3 nodes during off-peak hours. The steady-state node group remained stable at 5 nodes with no thrashing.
| Metric | Value | |
When to Use Each Tool, and When to Combine Them
The configuration decisions you make in the first sprint determine whether running both tools together closes the cost loop or creates two independent systems that conflict at the node layer.
Cluster Autoscaler and KEDA address different failure modes. Cluster Autoscaler prevents node over-provisioning on gradual, replica-driven demand. KEDA prevents idle compute accumulation on workloads that spend more time empty than active. The tools only produce compounding savings when the cluster architecture routes each workload type to the correct control plane, and when the node group topology lets Cluster Autoscaler act on the replica signals KEDA produces.
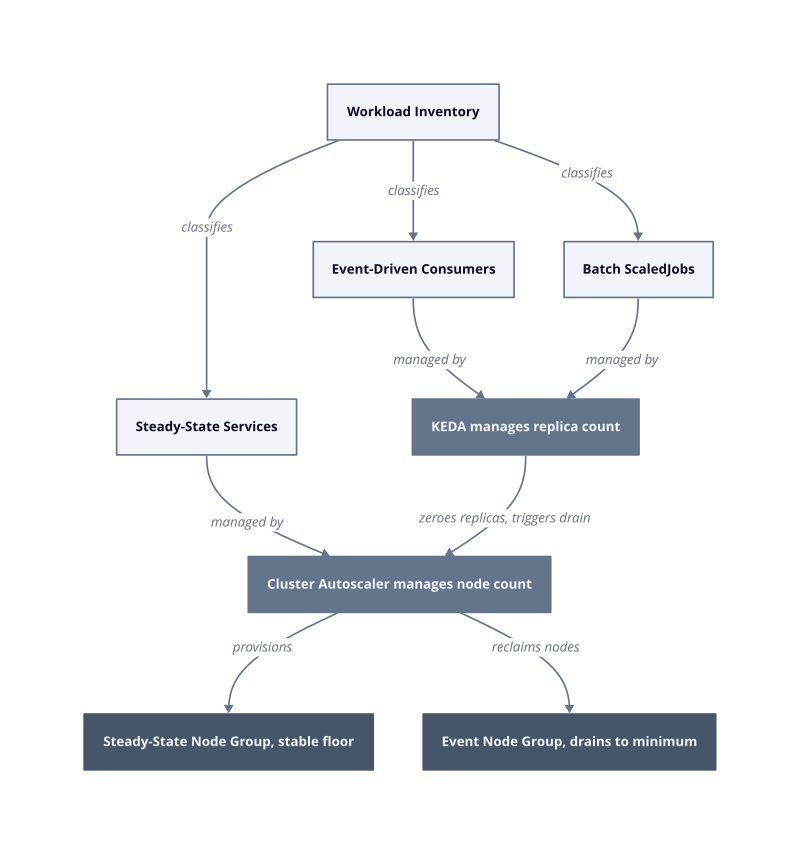
Use Cluster Autoscaler alone. Steady-state services with non-zero replica floors and gradual traffic growth need node-layer management, not event-driven replica control. The node provisioning latency is irrelevant because replica counts shift across hours, not seconds. Adding KEDA to a steady HTTP service introduces a live dependency on an external metric source with no cost benefit. This pattern works when traffic variance stays within a 3x band across a 24-hour window. It breaks when traffic drops to near zero overnight, because Cluster Autoscaler has no mechanism to remove pods. Nodes stay provisioned, billing continues, and the idle cost accumulates silently.
Use KEDA alone. Event-driven consumers and batch jobs that run on a defined schedule produce no Pending pods during idle periods. Cluster Autoscaler never sees scheduling pressure, so it never drains the nodes. KEDA’s zero-replica behavior is the only mechanism that removes pods from those nodes. This pattern works when the workload is fully asynchronous and the metric source is reliable. It breaks when the metric source goes unreachable and no fallback.replicas value is configured, because the scaler freezes or drains to zero and drops active consumers.
Run both tools together. The tandem pattern applies to mixed clusters carrying both workload types. KEDA zeroes replicas on the event-driven node group during off-peak hours. Cluster Autoscaler detects the empty nodes and begins its drain sequence after the unneeded threshold elapses. The cost reduction is structural: the event-driven node group stops carrying a persistent idle floor. We measured this configuration across a 3-node-group cluster after 30 days of baseline data collection. The event-driven
group dropped from a persistent 8-node floor to an average of 2.3 nodes during off-peak hours. The steady-state group held at 5 nodes with no thrashing. The mechanism is the handoff: KEDA controls replicas, Cluster Autoscaler controls nodes, and neither tool needs to know the other exists. They cooperate through the Kubernetes scheduler, not through any shared configuration.
The tandem pattern breaks under one specific condition. If the event-driven node group shares nodes with steady-state workloads, Cluster Autoscaler will not drain a node that still carries a running steady-state pod. KEDA zeroes the consumer replicas, but the node stays provisioned because the scheduler placed a long-running service pod on it during a previous scale-out. The fix is node group isolation: event-driven and batch workloads run on a dedicated node group with a taint, and steady-state services use a toleration that excludes them from that group. Without that boundary, the two tools work against each other at the node layer.
The configuration decision that determines real savings. Set scaleDown.unneededTime on Cluster Autoscaler to match your off-peak window, not the default 10 minutes. A batch cluster that empties at 5 PM and refills at 9 AM has a 16-hour reclaim window. The default 10-minute threshold works, but any misconfigured pod disruption budget that blocks eviction will hold a node through the entire window. Audit every PodDisruptionBudget on the event-driven node group before enabling the tandem pattern. A single PDB with minAvailable: 1 on a single-replica Deployment blocks node drain indefinitely.
| Decision Point | Correct Configuration | Failure Condition |
|---|---|---|
| Node group topology | Separate groups per workload type, taint-based isolation | Shared nodes block Cluster Autoscaler drain when KEDA zeroes replicas |
| KEDA fallback | fallback.replicas set on every ScaledObject | Metrics outage drains consumers to zero, drops messages |
| minReplicaCount | Set to 1 for latency-sensitive consumers | Scale-from-zero adds cold-start lat |
