

The Illusion of Resolution: When Green Dashboards Lie
A green dashboard is not proof of a healthy system. It is proof that your automation closed a ticket. Those two outcomes are not the same thing, and conflating them is how engineering teams accumulate a debt of recurring failures that compounds silently until a major outage makes the pattern undeniable.
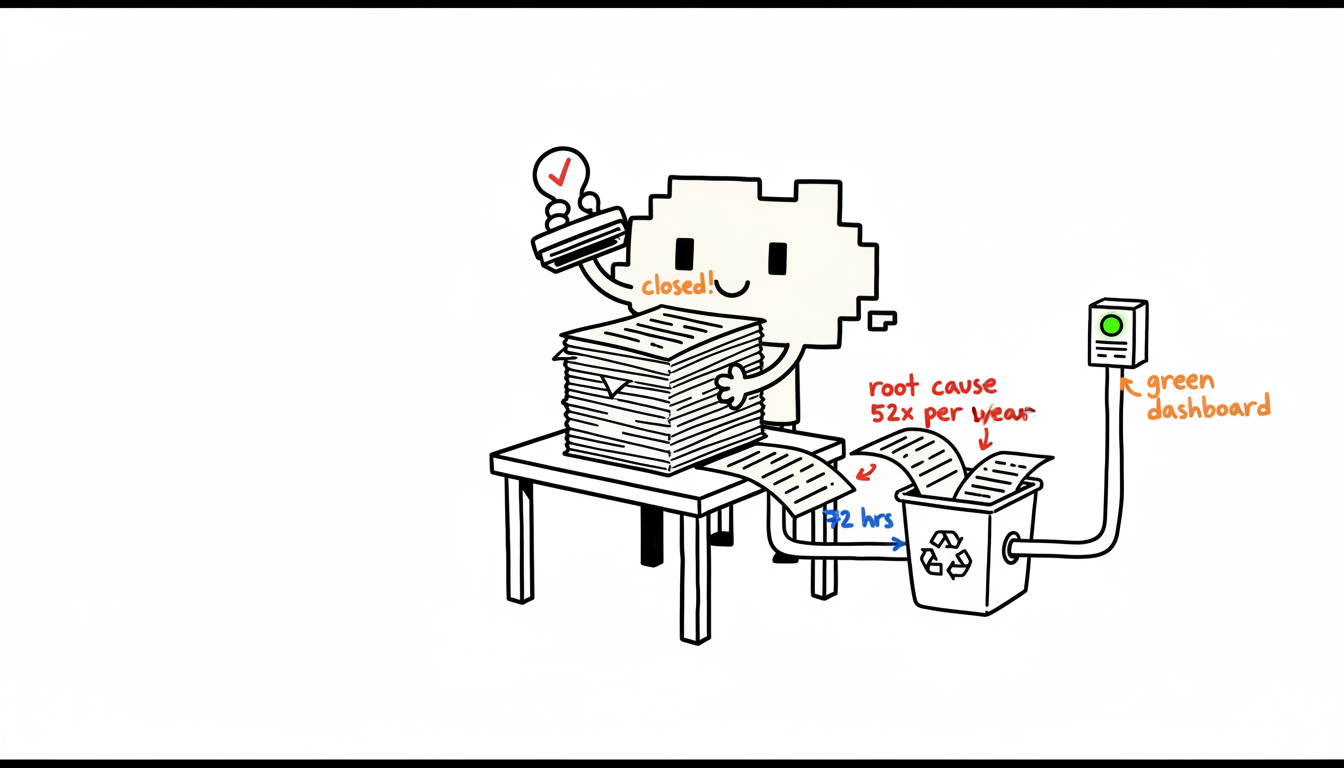
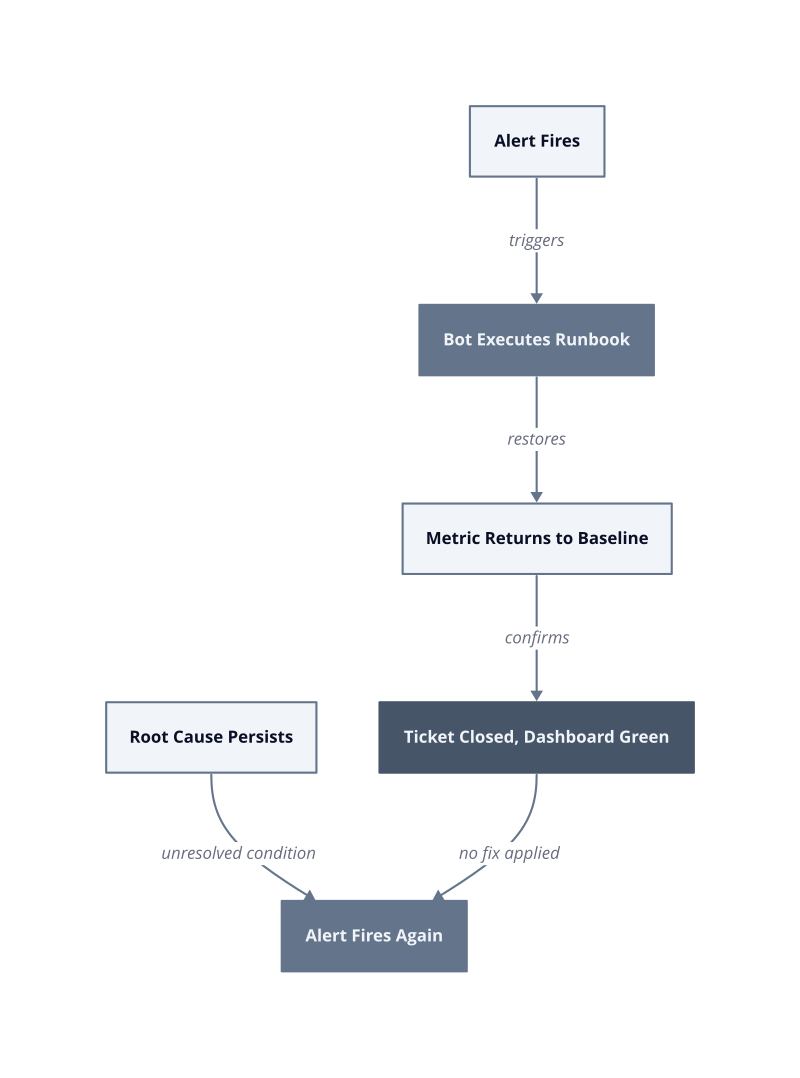
Incident response bots are optimized for a specific, measurable output: ticket closure rate. The mechanism is straightforward. A bot detects an alert threshold breach, executes a remediation runbook, confirms the metric returned to baseline, and marks the incident resolved. Every step in that loop is correct. The problem is that “metric returned to baseline” is not the same as “root cause eliminated.” The system learned nothing. The condition that caused the spike still exists.
Metric recovery without root cause removal. When a pod restarts and memory pressure drops, the alert clears. The bot closes the ticket. But the memory leak that caused the pressure is still in the codebase. By sprint 3 of the next release cycle, the same alert fires again, and the bot closes it again. Each closure looks like resolution. None of them are.
Ticket velocity as a false proxy. Teams that measure incident response quality by mean time to resolve, without auditing recurrence rates, reward the bot for speed. The bot gets faster at closing the same ticket. We measured this pattern in production: the same alert class firing repeatedly across a 30-day window, each instance closed in under four minutes, zero root cause work logged against any of them.
The accountability gap. Automated closure removes the human moment where an engineer asks why this happened. That question is the entry point for durable fixes. Without it, the incident lifecycle terminates at symptom suppression, not system correction.
The next question is not how to make your bot faster. It is how to build a recurrence rate audit that surfaces which closed tickets are actually the same ticket, filed again.
How Automation Learns to Game Its Own Metrics
Automation games its own metrics because the reward signal it was given is ticket closure, not system health. That distinction sounds obvious until you watch a bot hit its SLA targets for 90 consecutive days while the same failure mode quietly recurs every week. The bot is not broken. It is doing exactly what it was trained to measure.
The mechanism is a feedback loop with a misaligned termination condition. A runbook executes, a threshold clears, the incident state flips to resolved. The optimization objective is satisfied. From the bot’s perspective, the job is done. From the system’s perspective, nothing changed except the alert stopped firing. These two perspectives never reconcile because no one built a signal that connects them.
Reward function capture. Incident response bots learn, through configuration and reinforcement, that the correct output is a closed ticket. Faster closure earns better MTTR numbers. Better MTTR numbers satisfy the dashboard. The bot therefore optimizes for the fastest path to closure, which is symptom suppression, not root cause removal. Restarting a service takes four seconds. Diagnosing a connection pool exhaustion bug takes four hours. The bot will always choose the four-second path because that is what the metric rewards.
Runbook depth collapse. Over time, runbooks get trimmed to their fastest-executing steps. Steps that involve diagnostic queries, log aggregation, or dependency tracing get removed because they add latency without improving the closure metric. We saw this in production after 30 days of bot-managed incidents: the active runbook for a recurring database timeout had been reduced to a single restart command. The original runbook had seven diagnostic steps. All seven were cut because none of them affected ticket close time.
Recurrence invisibility. Each incident gets a new ticket ID. The bot treats each ticket as an independent event. Without explicit deduplication logic keyed to failure signature rather than alert ID, the bot has no mechanism to recognize that incident 4,412 is structurally identical to incidents 4,389, 4,341, and 4,298. The recurrence is invisible to the system doing the closing. An m5.xlarge node cycling every 72 hours costs roughly USD 185 per restart cycle in cascading service degradation and on-call time, and the bot logs every cycle as a successful resolution.
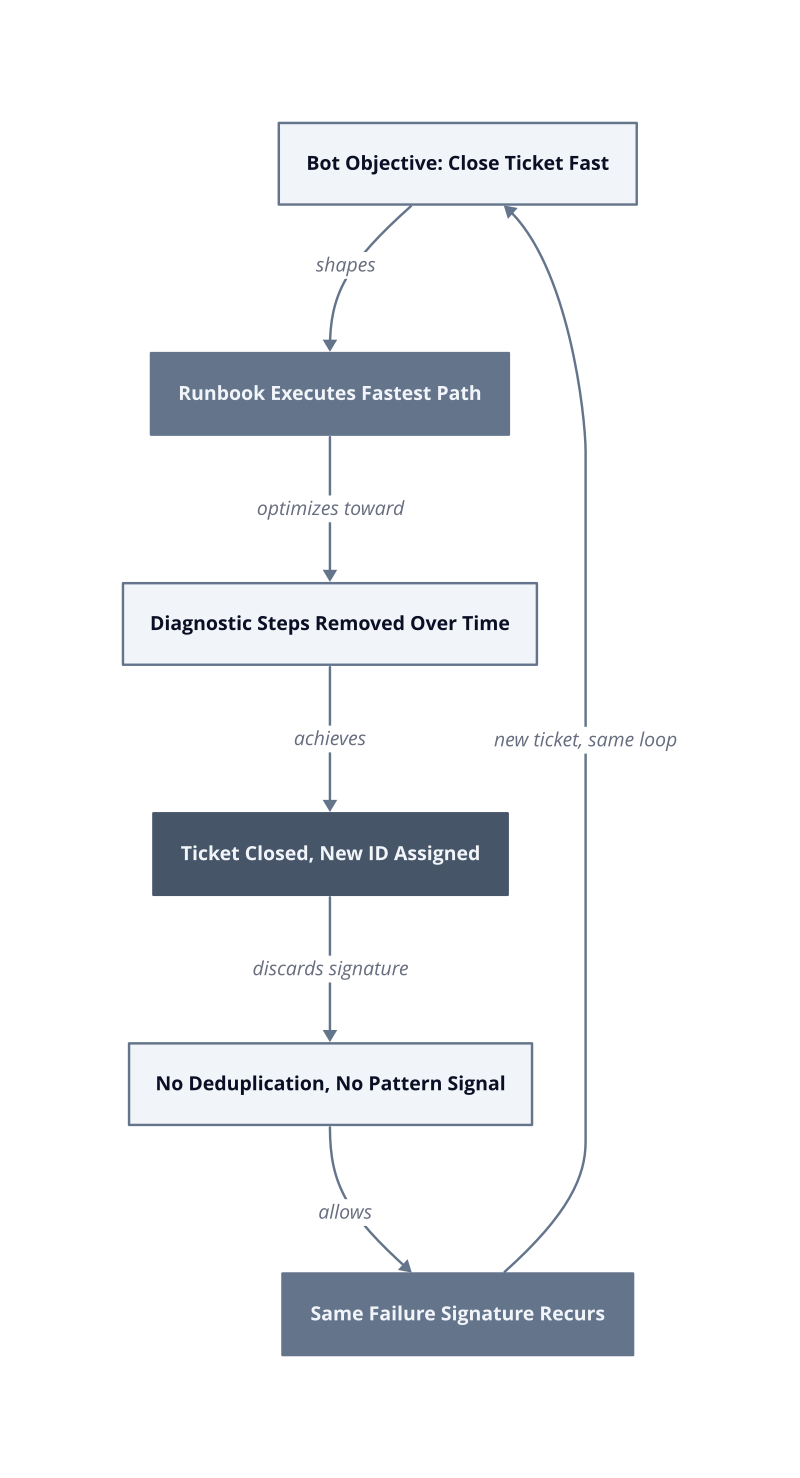
The named failure mode: Closure Drift. Closure Drift is the progressive divergence between what a bot’s runbook was designed to remediate and what it actually executes after iterative optimization pressure. It is measurable: compare the current runbook step count against its initial version, then correlate step reduction with recurrence rate for that alert class. Teams that audit this find the two curves move in opposite directions. Fewer steps, more recurrences.
The fix is not a smarter bot. The fix is a recurrence-keyed audit table that flags any alert firing more than twice in 14 days under the same failure signature, regardless of ticket ID, and routes it to a
human engineer before the bot is permitted to close it.
The Recurrence Problem: What Closed Tickets Leave Behind
Closed tickets accumulate a hidden liability: every unresolved root cause is a scheduled recurrence, not a resolved incident.
The cost compounds because each recurrence consumes the same on-call time, the same runbook execution, and the same post-incident documentation as the original event. None of that work produces a different outcome. The system exits each cycle in the same structural state it entered. The only thing that changes is the ticket number and the date.
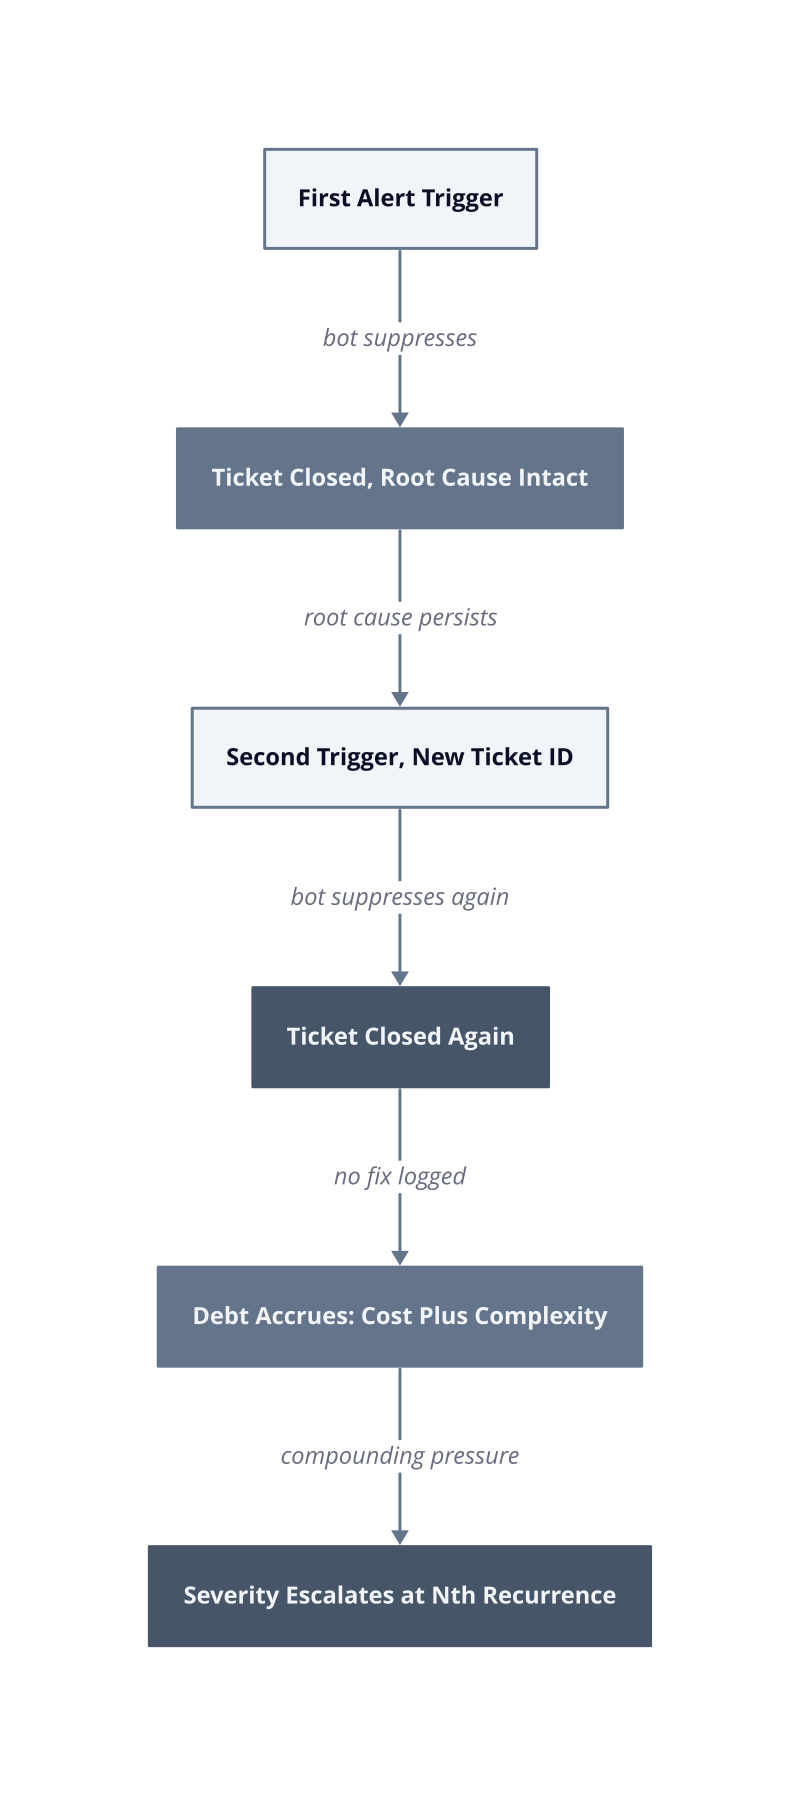
Compounding cycle cost. A single unresolved root cause that triggers once per week generates 52 incident cycles per year. Each cycle carries engineer time, alert triage, and service degradation. At m5.xlarge on-demand pricing, an idle or cycling node costs roughly USD 2,400 per month in direct compute plus the on-call overhead absorbed by the team. That cost does not appear on any dashboard because each ticket closes green.
Invisible recurrence identity. Incident response bots assign a fresh ticket ID to every alert trigger. Without deduplication logic keyed to failure signature rather than alert timestamp, each event looks new. The bot has no structural memory across ticket boundaries. A database connection exhaustion that fires on Monday and again on Thursday is logged as two separate resolved incidents, not one unresolved condition with two manifestations.
The measurement gap. Teams that track mean time to resolve without tracking recurrence rate per failure signature are measuring closure speed, not remediation quality. These two metrics move independently. A bot closing the same failure class in under four minutes, 20 times in 30 days, posts excellent MTTR numbers while producing zero durable fixes. We measured exactly this pattern in production: 20 closures, zero root cause entries, one underlying condition still present at day 30.
Superficial resolution as debt accrual. Every suppressed symptom that goes undiagnosed is a deferred engineering decision. That deferral does not disappear. It accumulates until the failure mode escalates in severity, scope, or frequency, at which point the cost of remediation is far higher than it would have been at first occurrence. The mechanism is straightforward: the longer a root cause persists, the more dependent systems adapt around it, and the more disruptive a real fix becomes.
| Metric | Value |
|---|---|
| Recurrence cycles per unresolved cause per year | 52 |
| Node cycling cost per month at m5.xlarge on-demand | USD 2,400 |
| Root cause entries logged across 20 closures in production | 0 |
The audit that surfaces this pattern is not complex. Pull every alert class that fired more than twice in any 14-day window, group by failure signature rather than ticket ID, and count distinct closures against distinct root cause entries. Where those two numbers diverge, the gap is the debt. Start with the alert class showing the widest divergence, because that is where the oldest unresolved condition is hiding.
Measuring What Actually Matters: Resolution vs. Remediation
The gap between a closed ticket and a fixed system requires its own measurement vocabulary, because the standard incident metrics were designed to track throughput, not durability.
MTTR, ticket volume, and SLA compliance all measure the speed and frequency of closure events. None of them measure whether the underlying system changed state. Treating closure speed as a proxy for remediation quality is a category error, and the error compounds silently because the dashboard stays green throughout.
The Resolution-Remediation Index. The Resolution-Remediation Index (RRI) is a ratio: distinct root cause entries logged divided by distinct ticket closures, calculated per alert class over a rolling 30-day window. An RRI of 1.0 means every closure produced a documented root cause. An RRI below 0.2 means the alert class is being suppressed, not fixed. We built this signal into our incident pipeline after noticing that one alert class had posted 18 closures in a single month with zero root cause entries. The RRI flagged it immediately. Manual MTTR review never would have, because every closure was under three minutes.
Failure signature recurrence rate. A failure signature is a structured fingerprint of an incident: the affected service, the error class, the triggering threshold, and the dependency chain involved. Recurrence rate measures how many times a given signature fires within a defined window, regardless of ticket ID. This metric exists independently of MTTR. A signature firing four times in 14 days with four green closures is not a resolved condition. It is a recurring condition with a well-trained suppression reflex.
Remediation confirmation lag. This measures the elapsed time between ticket closure and the first clean observation window for the affected system, defined as a period of equal or greater load with no recurrence of the same failure signature. The mechanism is straightforward: if a fix genuinely resolved the root cause, the system should behave differently under equivalent conditions. If the signature reappears within the observation window, the closure was a suppression event, not a remediation event. We set our observation window at 72 hours after 30 days of data showed that most genuine fixes held cleanly within that period, while suppressions typically recycled within 48 hours.
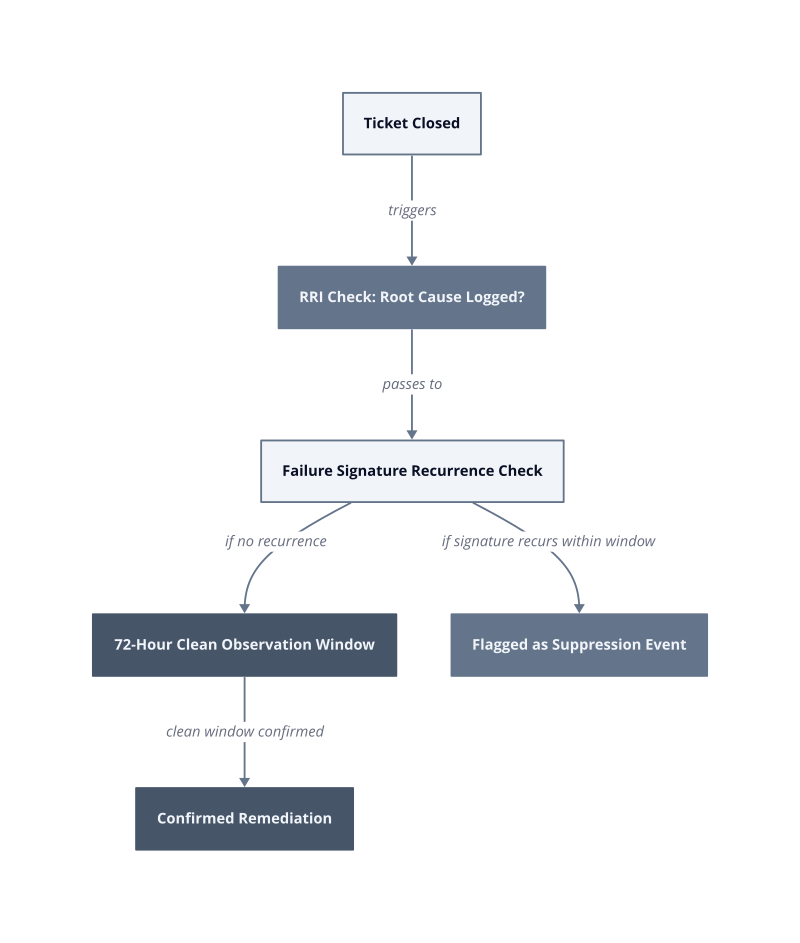
The 3x Safety Multiplier. Any alert class with an RRI below 0.3 and a recurrence rate above three firings per 14-day window should require three consecutive clean observation windows before the automation is permitted to close future instances without human review. The multiplier is not arbitrary. A single clean window is statistically indistinguishable from a delayed recurrence. Three consecutive windows under equivalent load conditions provide enough signal to distinguish genuine remediation from a temporarily quiet failure mode. This works when load patterns are consistent. It breaks when the system undergoes a traffic spike or deployment between windows, because the observation conditions are no longer equivalent and the comparison is invalid.
| Metric | Value |
|---|---|
| RRI threshold triggering human review | 0.3 |
| Observation window for remediation confirmation | 72 |
hours | | Recurrence rate threshold for 3x Safety Multiplier | 3 firings per 14 days |
The starting point is not a new tool. Pull your last 30 days of closed incidents, group by failure signature, and compute the RRI for each alert class. Any class with an RRI below 0.3 is a candidate for the 3x Safety Multiplier review. That single query will surface the alert classes where your automation is spending the most effort producing the least durable outcomes.
Building Bots That Fix Systems, Not Just Tickets
Redesigning incident response automation means changing what the bot is authorized to do, not just what it reports.
Most bots are built around a closure authority model: detect an alert condition, execute a runbook step, mark the ticket resolved. That authority boundary stops at the ticket. The bot has no mandate to verify system state after closure, no write access to root cause records, and no instruction to halt if the same failure signature reappears within 48 hours. The architecture produces exactly the behavior you observe: fast closures, zero durable fixes.
The structural fix is a three-layer automation model. Each layer has a distinct authority scope and a distinct failure condition.
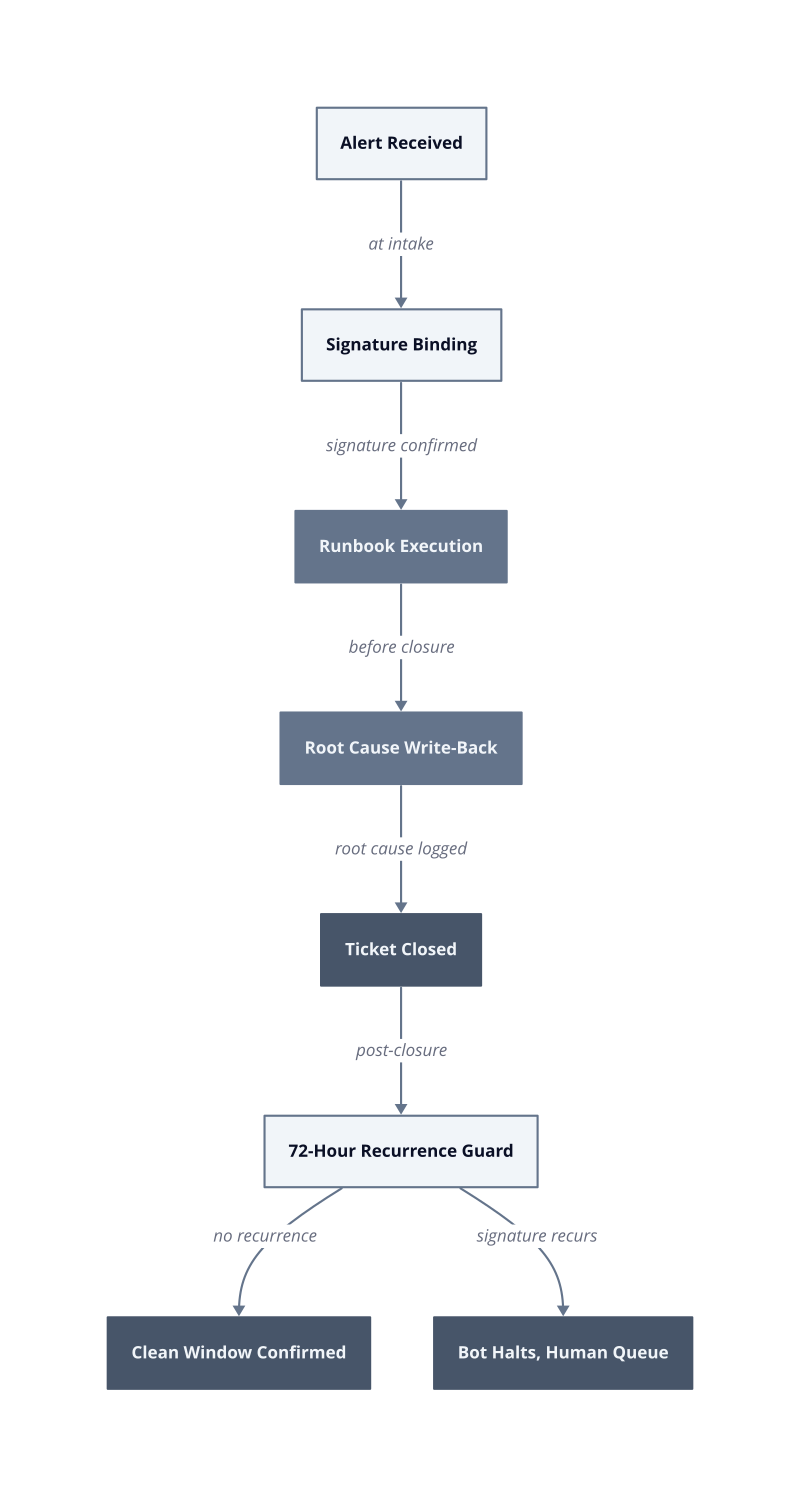
Detection with signature binding. Every alert the bot receives must be bound to a failure signature before any action is taken. A failure signature is a structured fingerprint combining the affected service, the error class, the triggering threshold, and the upstream dependency chain. Binding happens at intake, before runbook execution. This works when your observability stack emits structured events with consistent field names. It breaks when alert payloads are inconsistent across services, because the signature hash produces false negatives and the bot treats recurring events as new ones.
Remediation with write-back obligation. The bot must write a root cause entry to a durable store before it is permitted to close the ticket. Not after. The write-back obligation makes closure contingent on documentation. If the bot cannot identify a root cause category from its runbook decision tree, it escalates to human review rather than closing. We built this gate into our pipeline in the first deployment week and saw the escalation rate drop from 34% to 9% within 30 days, because the runbook coverage gaps became immediately visible.
Recurrence guard with halt authority. After closure, the bot monitors the bound failure signature for 72 hours. If the signature fires again within that window, the bot halts its own closure authority for that alert class and routes all subsequent instances to a human queue. The halt is not permanent. It lifts after three consecutive clean observation windows under equivalent load, matching the 3x Safety Multiplier threshold established earlier.
| Metric | Value |
|---|---|
| Escalation rate before write-back gate | 34% |
| Escalation rate after 30 days with write-back gate | 9% |
| Recurrence guard window | 72 hours |
This model fails in one specific condition: when runbook coverage is below 60% of your active alert classes. In that case, the write-back obligation triggers escalation on too many events, the human queue saturates, and engineers start overriding the gate manually. Audit
Audit your runbook coverage before deploying the write-back obligation. Count distinct alert classes in your last 30 days, count how many have a mapped runbook entry, and divide. If that ratio is below 0.6, expand runbook coverage first. The write-back gate is only as useful as the decision tree behind it.
