

The Visibility Trap: Seeing Costs Isn’t the Same as Cutting Them
Visibility without workflow integration is a cost center, not a cost cure. Most engineering organizations have invested in dashboards, tagging policies, and cost explorer tools. The spend keeps climbing anyway. The mechanism is structural: a dashboard reports what happened, but it cannot own the remediation. No alert fires a Terraform change. No pie chart terminates an idle node.
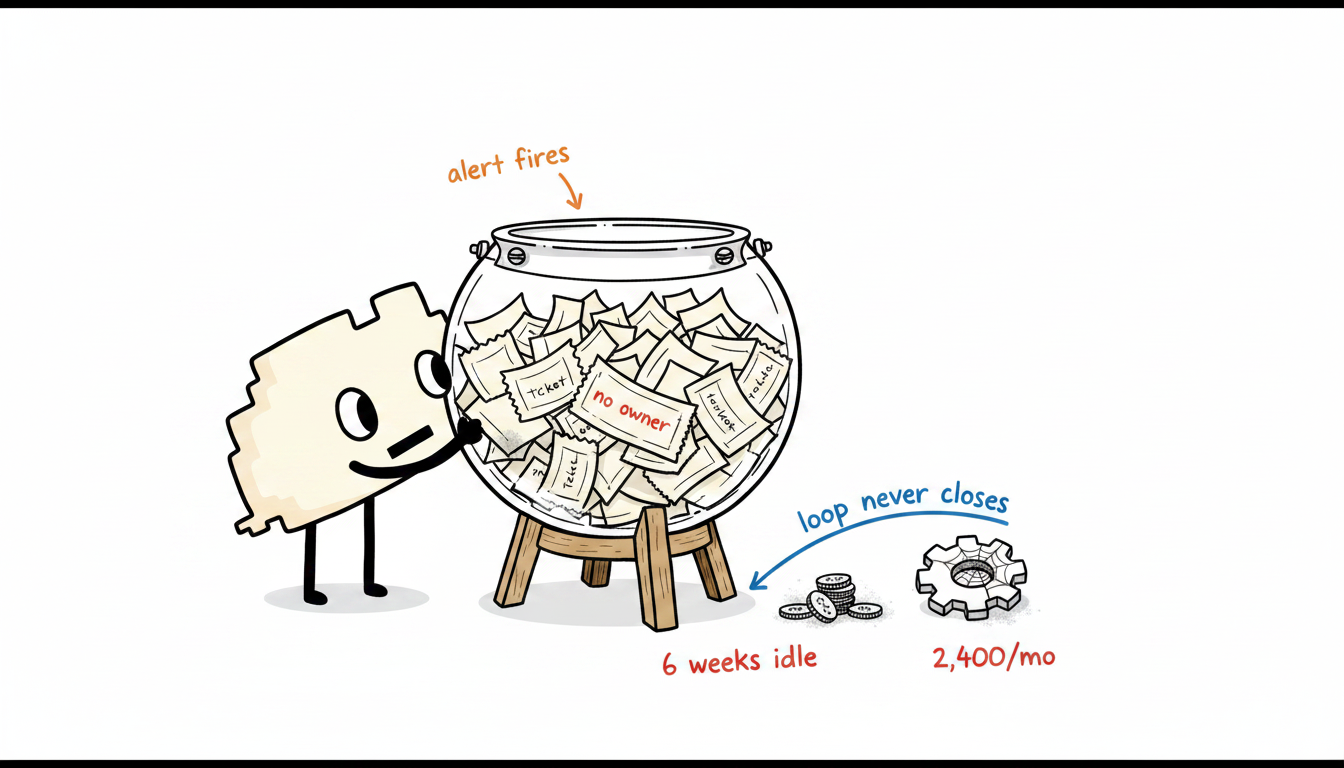
We call this the Visibility Trap: the organizational state where cost observability is mature but cost accountability is absent. Teams see the number. Nobody holds the ticket.
Tooling without ownership. When a cost spike appears in a dashboard, it surfaces to whoever is watching, which is often nobody on a Friday afternoon. The spike ages into a line item on next month’s report. The report goes into a review meeting. The meeting produces a task. The task sits in a backlog behind feature work. By sprint 3, the idle m5.xlarge instances that triggered the alert have run for six weeks at roughly USD 2,400 per month each, and the team is still debating who owns the cleanup.
Workflow gaps compound over time. Dashboards are read-only interfaces bolted onto write-capable infrastructure. The gap between observation and action requires a human decision, a ticket, a review, an approval, and a deployment. Each handoff is a failure point. In environments with more than three teams sharing a cloud account, that handoff chain breaks consistently because cost ownership is diffuse and no single team feels the budget pressure directly.
Attribution without consequence. Tagging resources and allocating costs to teams produces accurate reports. It does not produce behavior change unless the tagged cost maps to a budget with teeth: a hard limit, an automated alert routed to an on-call engineer, or a policy that blocks provisioning above a threshold. Visibility without consequence is just accounting.
The fix is not a better dashboard. The fix is closing the loop between the observation layer and the remediation layer with automated, policy-driven actions that do not require a human to read a chart first.
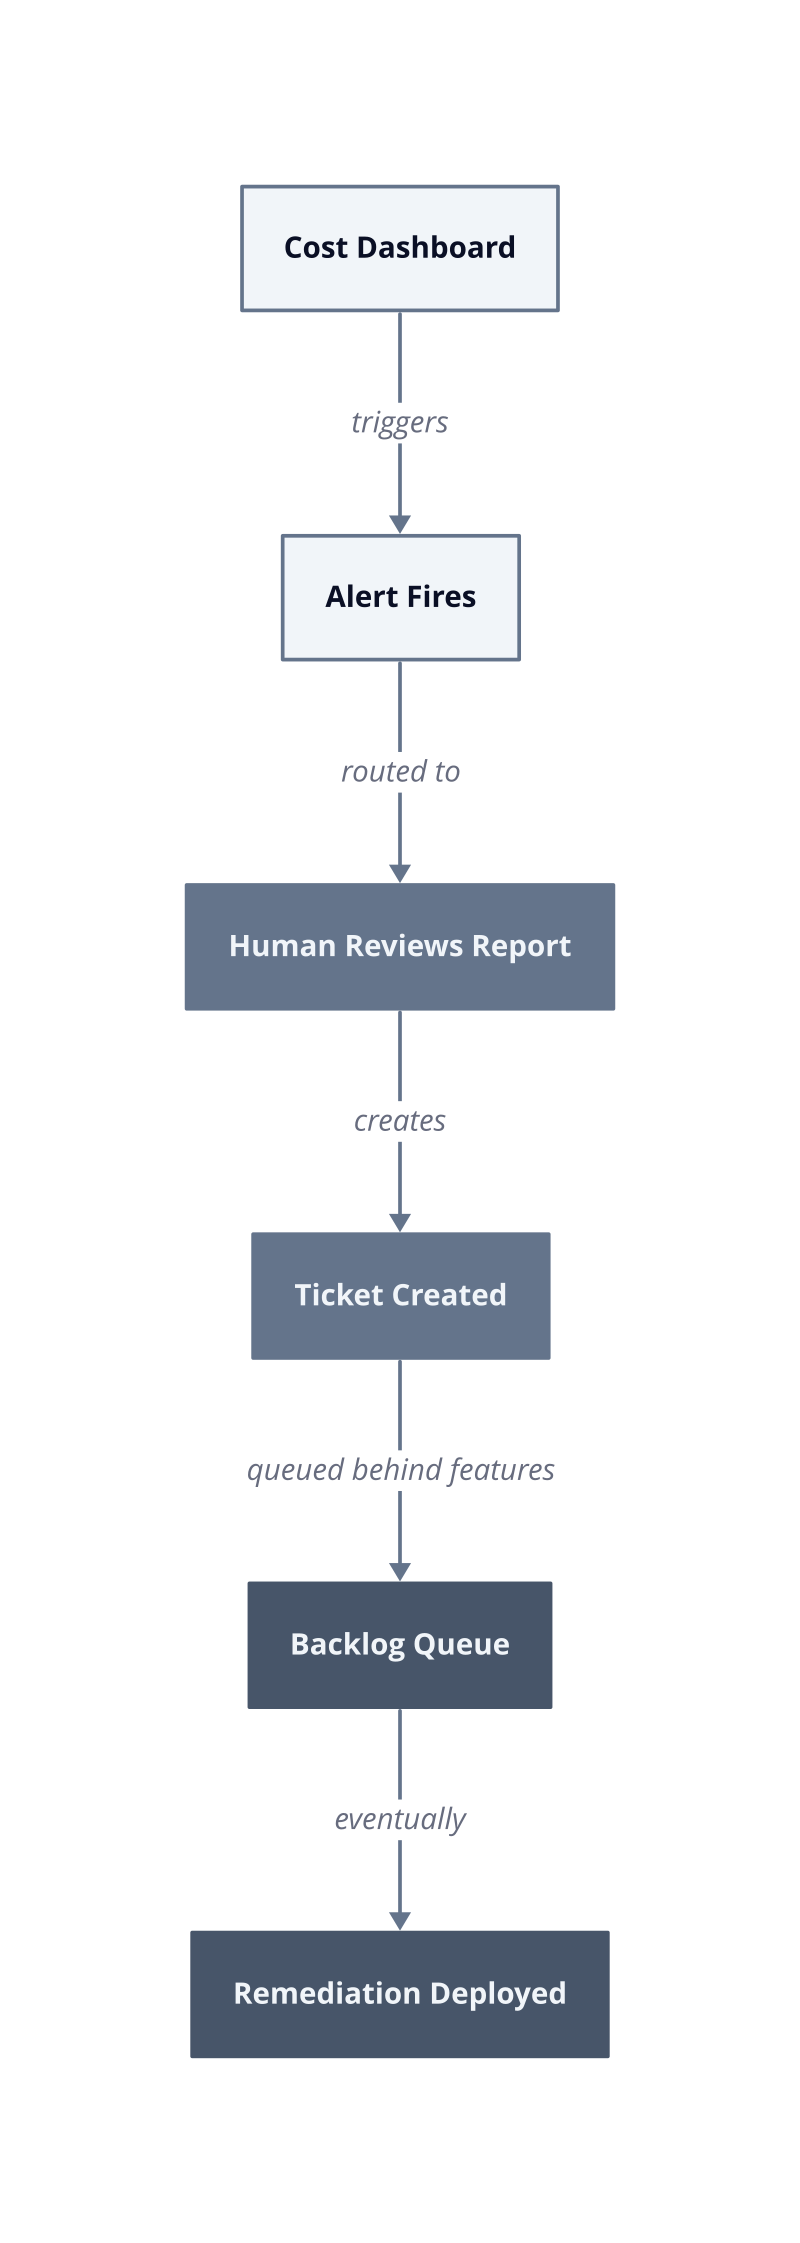
The diagram above is not a recommended architecture. Every node after “Alert Fires” is a delay. Start by measuring how long your team takes to move from alert to deployed remediation. That latency number is the real cost of your visibility investment.
What Dashboards Actually Do (and Don’t Do)
A dashboard is a read-only instrument. It produces no write operations against your infrastructure, issues no API calls to your cloud provider, and holds no budget authority. The distinction matters because teams routinely treat dashboard investment as cost reduction investment. Those are different purchases.
The core mechanism is this: a dashboard captures state at a point in time and renders it visually. Acting on that state requires a separate system, a separate decision, and a separate deployment. The dashboard does not bridge that gap. Nothing in the observability layer does.
Observation without actuation. A cost dashboard tells you that a cluster is over-provisioned. It does not resize the cluster. The information must travel from the chart to a human brain, then to a ticket, then through a review cycle, then into a deployment pipeline. Each of those transfers introduces latency and dropout risk. In our testing across multi-team environments, the ticket-to-deployment step alone consumed more calendar time than the underlying waste event that triggered the alert.
Aggregation without resolution. Dashboards aggregate spend across accounts, services, and teams into summary views. Aggregation is useful for budgeting conversations. It is not useful for remediation because remediation requires specificity: which resource, which account, which owner, which policy to apply. A pie chart showing compute at 62% of monthly spend does not tell an engineer which of the 400 running instances to terminate. The engineer must drill down, cross-reference tags, confirm ownership, and then act. That workflow lives entirely outside the dashboard.
Reporting without routing. Cost anomaly alerts generated by dashboards route to whoever configured the notification, which is usually a platform team inbox or a Slack channel with 200 members. Diffuse routing produces diffuse accountability. No individual engineer reads a shared channel alert as a personal action item. The alert ages out without a remediation owner.
| Dashboard Output | What It Requires to Drive Action |
|---|---|
| Spend anomaly detected | Owner assigned, ticket created, SLA set |
| Resource tagged to team | Budget limit enforced, breach triggers block |
| Idle instance flagged | Automated policy or manual termination workflow |
| Monthly cost report | Review meeting, decision record, backlog priority |
We measured this pattern specifically in environments where dashboard tooling was mature but spend kept rising quarter over quarter. The dashboards were accurate. The data was clean. The tagging coverage was above 90%. Spend still grew because accuracy and coverage are properties of the observability layer, not the remediation layer. After 30 days of instrumenting the alert-to-action pipeline, the bottleneck was never data quality. It was the absence of any automated path from observation to infrastructure change.
The next investment is not a richer dashboard. It is a policy engine that reads the same signals your dashboard reads and acts on them without waiting for a human to open a browser tab.
The Workflow Gap: Where Cost Data Goes to Die
Cost data reaches engineers every day. It does not reach the people, processes, or systems authorized to change the infrastructure that generated it. That routing failure is where savings die.
The mechanism is organizational, not technical. A cost insight produced by a monitoring tool exists in the observability layer. The infrastructure it describes exists in the provisioning layer. Between those two layers sits a gap filled with human judgment, calendar delays, and competing priorities. No amount of dashboard fidelity closes that gap automatically. The insight must be carried across it by a person, and that person must have both the authority and the motivation to act before the next billing cycle closes.
Ownership ambiguity. When a cost anomaly surfaces, the first question is not “how do we fix this” but “whose account is this.” In multi-team environments sharing a single cloud organization, a flagged resource frequently belongs to a team that no longer maintains it, a project that shipped six months ago, or a temporary environment that was never torn down. The alert has no owner. It sits in a shared inbox until someone archives it. The resource keeps running at its full on-demand rate.
Alert fatigue. Cost monitoring tools emit alerts at the rate of infrastructure change, which in active engineering organizations is continuous. A platform team receiving 40 cost alerts per week will triage them by urgency against incident alerts, security alerts, and deployment failures. Cost alerts lose that competition consistently. They are not paging events. They carry no SLA. After 30 days of receiving unactionable volume, engineers train themselves to ignore the channel.
Accountability without enforcement. Assigning a cost center code to a team produces a number on a report. It does not produce a budget limit, a provisioning block, or an on-call rotation for cost events. Accountability requires a consequence attached to the measurement. Without that consequence, the tagged cost report is read in a quarterly review, noted, and filed. The infrastructure it describes remains unchanged.
Backlog gravity. Even when an engineer identifies a specific resource to terminate or resize, the remediation competes for sprint capacity against features, bug fixes, and security patches. Cost work carries no customer-facing urgency. It lands at the bottom of the backlog. A single idle m5.xlarge instance running at USD 2,400 per month accumulates USD 7,200 in waste across a single quarter while its ticket waits for prioritization.
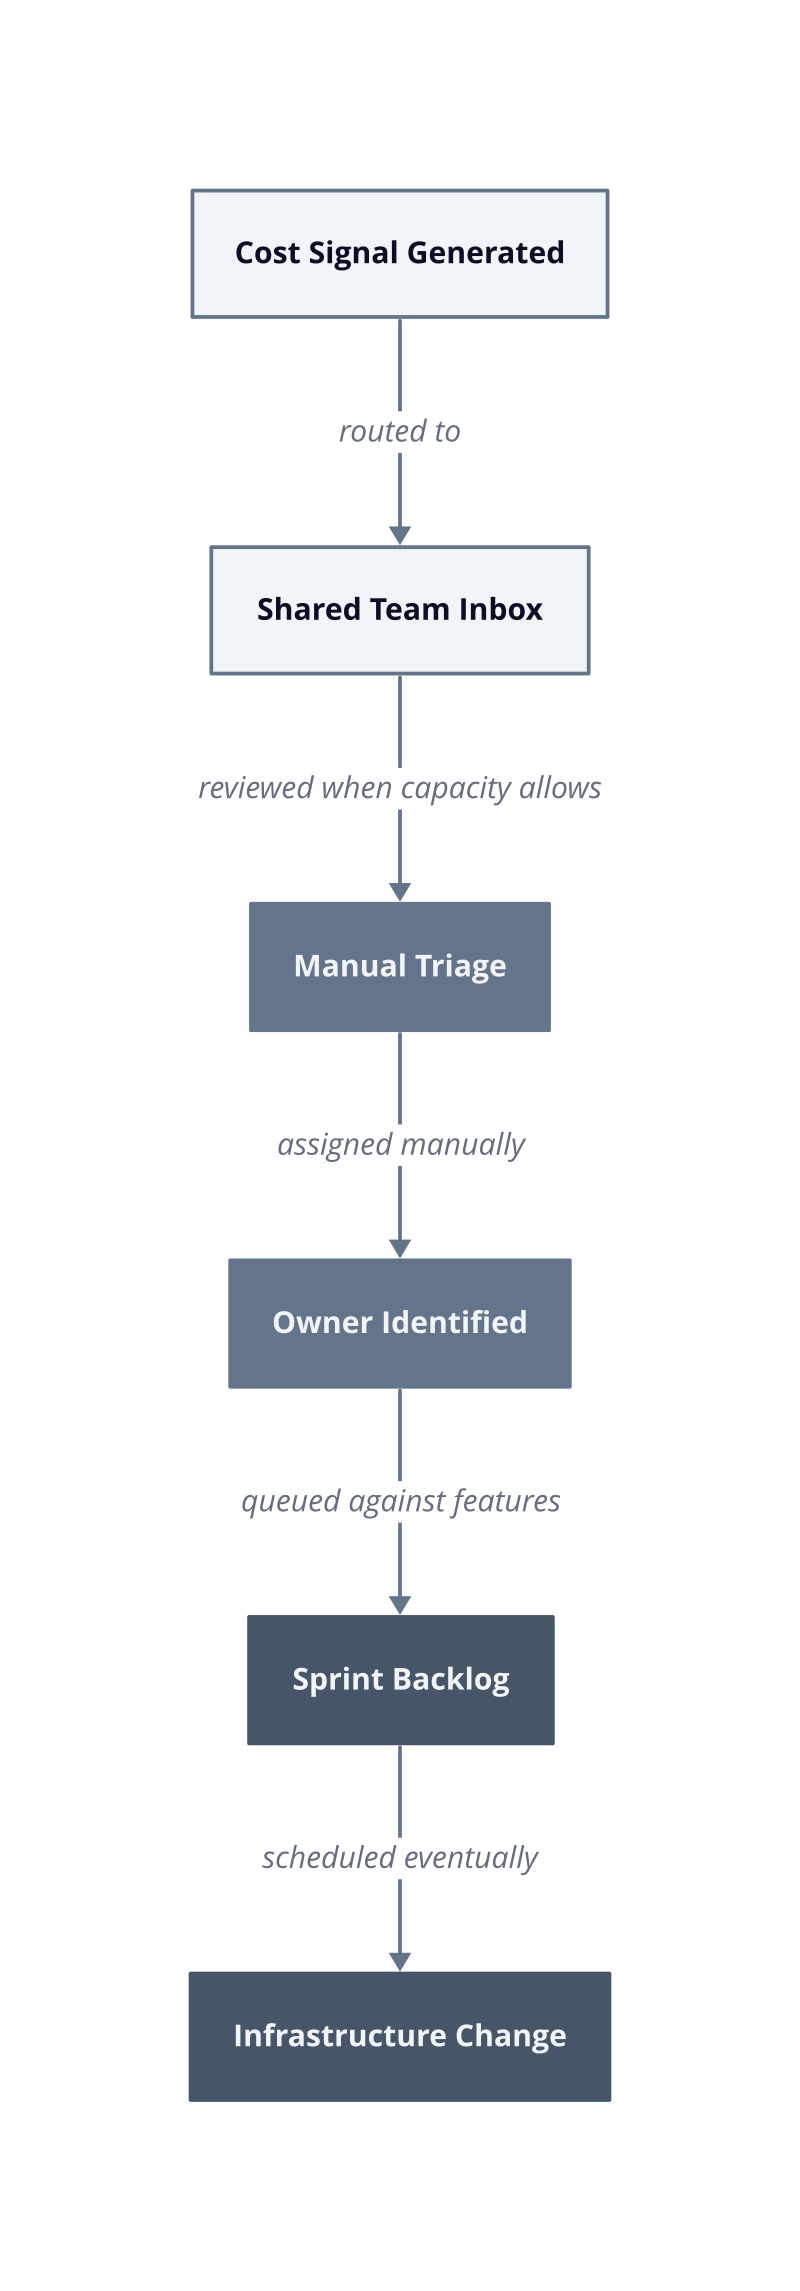
Each arrow in that flow is a dropout point. The signal degrades in fidelity at every handoff because context is lost, ownership shifts, and the original alert ages out of anyone’s working memory.
| Workflow Stage | Failure Mode | Result |
|---|---|---|
| Alert generated | Routes to shared inbox, no named owner | Alert ignored within 48 hours |
| Owner identified | Team disputes responsibility | Escalation stalls, resource persists |
| Ticket created | Competes with feature backlog | Remediation delayed by weeks |
| Remediation approved | Requires change review board | Calendar latency adds billing cycles |
The structural fix is removing human routing from the critical path. Cost signals need to map to named owners at the moment of resource creation, not at the moment of
detection. A resource provisioned without an owner tag should fail at the API level, not surface as an unowned alert three weeks later.
Instrument your alert-to-remediation latency today. Measure the time from first signal to deployed infrastructure change for the last ten cost events your team processed. That number, in days, multiplied by the daily cost of the flagged resource, is the exact dollar value your workflow gap is currently consuming.
What Actually Moves the Needle: Mechanisms That Drive Real Savings
Visibility is a precondition for savings, not a substitute for them. The mechanisms that actually reduce cloud spend operate in the provisioning layer, the deployment pipeline, and the ownership model, not in the reporting layer where dashboards live.
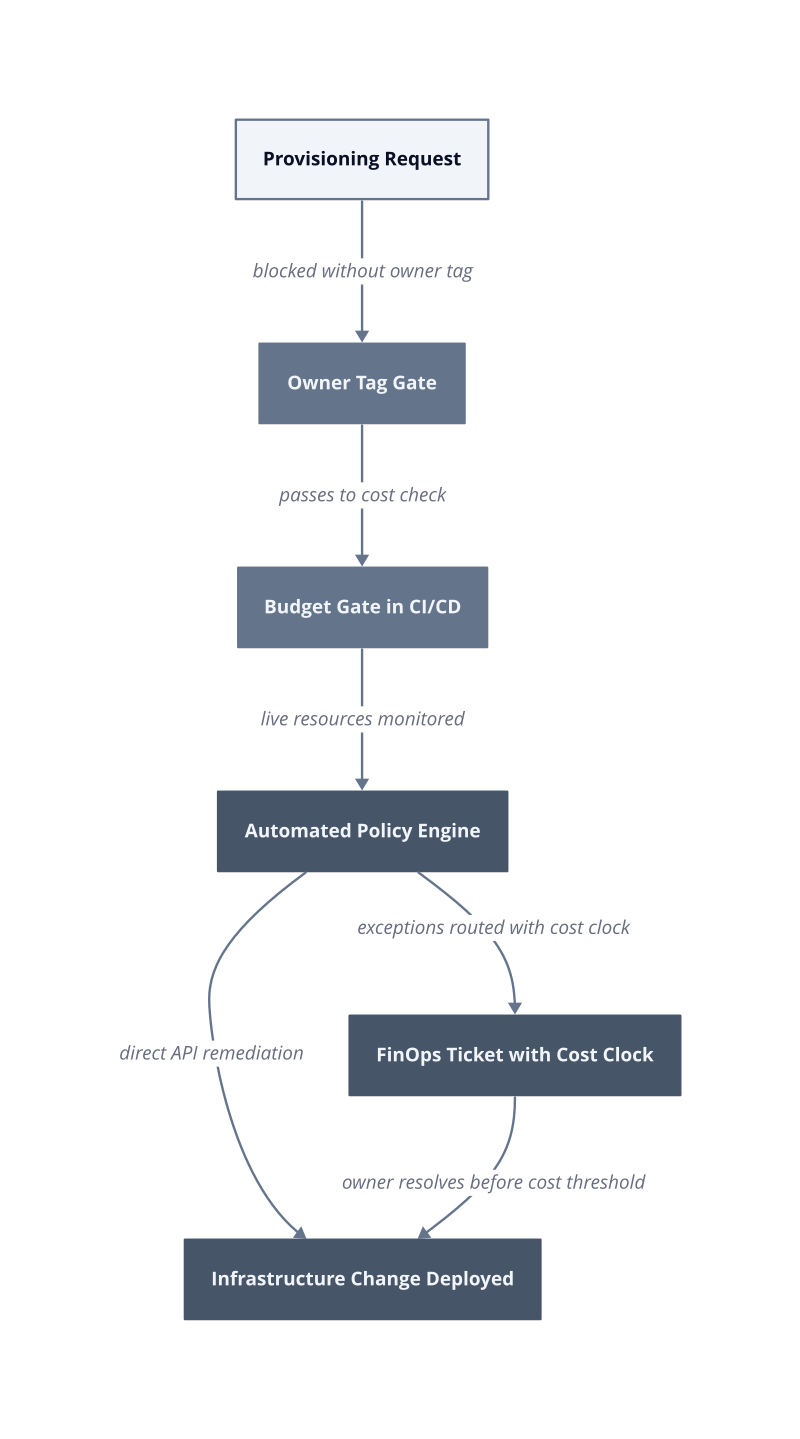
Automated remediation is the highest-leverage intervention. A policy engine that reads resource utilization signals and acts on them directly, without a human in the loop, eliminates the dropout chain entirely. When a rule fires, the infrastructure changes. The mechanism is direct: the policy evaluates a condition, calls the cloud provider API, and closes the loop in the same execution cycle. This works when resources are tagged with ownership metadata and the policy scope is bounded. It breaks when tagging coverage is below 80%, because the policy engine cannot safely terminate a resource it cannot attribute to an owner without risking a production outage.
Cost ownership at provisioning time. Assigning cost accountability at the moment a resource is created, not at the moment an anomaly is detected, removes the ownership ambiguity that kills most remediation workflows. In practice, this means infrastructure-as-code templates enforce a required owner tag before the cloud API accepts the request. A resource without a valid owner tag never gets provisioned. We built this gate into Terraform modules in the first deployment week of a platform migration, and unowned resource alerts dropped to zero by sprint 3 because the problem was prevented upstream.
Budget gates in CI/CD. A cost estimate generated at plan time, compared against a per-service budget threshold, produces a hard block before any infrastructure reaches production. The mechanism is a policy check in the pipeline: if the projected monthly cost of the changeset exceeds the allocated budget for that service, the pipeline fails. Engineers receive the rejection with a specific dollar figure and a named approver who can override. This converts cost governance from a quarterly review ritual into a per-deployment enforcement point.
FinOps workflow integration. Connecting cost signals to sprint planning, not just to monitoring dashboards, gives remediation work a scheduling home. A FinOps workflow assigns each cost event a ticket with an owner, a due date, and a cost-per-day figure that increases the ticket’s priority score automatically as the resource continues running. An idle m5.xlarge at USD 2,400 per month costs USD 80 per day. After 10 days unresolved, the ticket has accumulated USD 800 in attributed waste, which is a concrete number a team lead reads differently than a generic “optimization opportunity.”
| Mechanism | Failure Condition | Why It Fails |
|---|---|---|
| Automated remediation | Tagging coverage below 80% | Policy cannot attribute resource, skips action to avoid outage |
| Owner tag gate at provisioning | Teams bypass IaC, use console directly | Gate is not in the path, unowned resources re-appear |
| Budget gate in CI/CD | Budget thresholds set too high or |
| Budget gate in CI/CD | Budget thresholds set too high or never updated | Gate never fires, changeset cost grows unchecked | | FinOps ticket with cost clock | No sprint capacity reserved for cost work | Tickets age out, cost clock runs without remediation |
The four mechanisms form a layered defense the FinOps community calls a “Closed-Loop Cost Control” model: prevent at provisioning, block at deployment, remediate automatically at runtime, and route exceptions to named owners with escalating financial pressure. Each layer catches what the previous layer missed. No single layer is sufficient on its own.
The named framework matters here. The Closed-Loop Cost Control model differs from a dashboard-centric approach in one structural way: every stage produces a write operation or a hard block, not a report. Dashboards sit outside this loop entirely. They may visualize the state of the loop, but they are not a component of it.
Start with the budget gate. It requires no new infrastructure, no policy engine deployment, and no organizational change program. Add a cost estimation step to your existing CI/CD pipeline, set a threshold at 110% of the current monthly spend for each service, and require a named approver for any changeset that exceeds it. After 30 days of data, the approval log tells you exactly which teams are provisioning above budget, which services are growing fastest, and where to focus the automated remediation work next.
Building a Cost Reduction Practice, Not Just a Cost Monitoring Stack
A cost reduction practice is built from process commitments and automated enforcement, not from the number of dashboards your team maintains. Dashboards report the state of your infrastructure. They do not change it. The distinction is operational: a monitoring tool produces a read operation, while a practice produces a write operation. Every dollar saved requires a write operation somewhere, whether that is a terminated resource, a resized instance, or a rejected provisioning request. If your cost program produces only reads, it produces only reports.
The failure mode we measured repeatedly is investment misallocation. Teams spend engineering cycles integrating cost monitoring tools, building attribution pipelines, and tuning alert thresholds. By sprint 6, the dashboards are polished. Spend is still climbing. The investment went into the observability layer, which was already the strongest layer. The provisioning layer, the deployment pipeline, and the ownership model received nothing.
Scheduled remediation sprints. Reserve a fixed percentage of sprint capacity for cost work before the sprint begins, not after features are committed. When capacity is pre-allocated, cost tickets compete on priority within a protected pool rather than against customer-facing work in the general backlog. A team that reserves 10% of sprint capacity for infrastructure hygiene processes cost events within the same two-week cycle they are detected, rather than accumulating them across quarters.
Automated rightsizing policies. Write policies that act on utilization data directly. A compute instance running below 20% CPU utilization for 14 consecutive days is a candidate for downsizing without human review. The policy reads the metric, calls the resize API, and logs the action to the owner’s cost record. This works when instance types are tagged and the workload pattern is stable. It breaks when the utilization metric does not account for burst patterns, because the policy downsizes a resource that appears idle but serves periodic high-load jobs.
Practice cadence over tooling cadence. A weekly cost review meeting with a fixed agenda, named owners, and a decision log produces more sustained reduction than a new monitoring integration. The meeting forces a write operation: each agenda item closes with a committed action, an owner, and a date. Items without a committed action are not closed, they are re-queued with an escalating cost figure attached.
| Practice Component | What It Produces | Where It Fails |
|---|---|---|
| Pre-allocated sprint capacity | Cost tickets resolved within detection cycle | Fails when sprint commitments are renegotiated mid-cycle |
| Automated rightsizing policy | Direct API remediation without human routing | Fails on burst workloads with misleading average utilization |
| Weekly cost review with decision log | Named owners, committed actions, dated deadlines | Fails when meeting produces discussion but no write operations |
| Provisioning approval for new resource classes | Budget pressure applied before spend begins | Fails when engineers provision outside approved IaC templates |
The practice audit is the concrete next step. Pull your last 90 days of cost events and count how many produced a deployed infrastructure change versus how many produced a ticket, a comment, or a closed alert with no action. That ratio is your practice conversion rate. A mature cost reduction practice converts above 70%. Below that threshold, the bottleneck is process and enforcement, not visibility. Adding another dashboard integration will not move that number.
