

The Hidden Complexity Behind HPA’s Simple Promise
HPA looks like a three-field YAML block until the fourth silent dependency fails and the controller stops scaling without logging a human-readable error. The abstraction is thin. Beneath it sits a dependency chain where metrics-server, kubelet TLS, container resource requests, and the aggregated API layer must all function correctly before a single scaling decision fires.
The metrics-server README documents a ceiling of 100 nodes, 70 pods per node, and 100 HPA-managed deployments before the default configuration becomes unreliable. Teams that cross these thresholds without tuning metrics-server see stale utilization data, which causes the HPA controller to act on numbers that are already out of date, given that Metrics Server collects resource metrics every 15 seconds (Resource Metrics Pipeline - Kubernetes Docs).
The defaults embedded in the HorizontalPodAutoscaler v2 API create a second class of surprises.
Scale-down inertia. The stabilization window for scale-down defaults to 300 seconds. That delay exists to prevent flapping, but it also means a workload that drops to zero traffic holds its full replica count for five minutes. In a namespace with a tight resource quota, those idle pods block new deployments from scheduling.
Floor without a basement. minReplicas defaults to 1. Setting it to 0 requires enabling the alpha feature gate HPAScaleToZero and configuring at least one Object or External metric. Teams that assume scale-to-zero works out of the box discover this only after a weekend of unexpected idle-node costs.
Invisible utilization math. Kubernetes resource requests are the denominator in every CPU and memory utilization percentage the HPA controller computes. Without a request value on the container spec, the metrics pipeline cannot produce a ratio. The controller stalls at the current replica count and emits no alert, because from its perspective the metric is simply absent.
Collapsed replica range. Setting maxReplicas equal to minReplicas produces an HPA that never moves. The controller enforces the declared bounds, so any computed desired replica count outside a single value is clamped back immediately. The fix is to treat these two fields as a range, not a point.

Any break in this chain produces a frozen controller. After 30 days of watching teams debug HPA in self-managed clusters, the most common failure is metrics-server failing TLS verification against kubelets when --kubelet-insecure-tls is omitted. The controller enters a ScalingDisabled condition. The workload neither scales up under load nor scales down during quiet periods. The next section addresses each failure mode with a specific remediation.
Defaults That Bite: What HPA Assumes When You Say Nothing
HPA ships with four numeric defaults that interact silently, and each one becomes a liability the moment your workload deviates from the happy path the Kubernetes authors imagined.
The CPU utilization target that most teams inherit without reading is 80%. The mechanism is straightforward: the controller divides observed CPU usage by the requested CPU value to produce a ratio, then compares that ratio against 80%. This target works for batch workloads with smooth ramp-up curves. It breaks for latency-sensitive services because the gap between 80% utilization and request saturation is narrow enough that a single traffic spike fills it before new pods pass readiness probes. The fix is to treat 80% as a ceiling to lower, not a sensible starting point.
Tolerance deadband. The default cluster-wide tolerance is 10%, meaning no scaling updates are made if the ratio between current and desired metric value sits within 10% of the target (HorizontalPodAutoscaler v2 API Reference). This deadband exists to suppress noise from momentary metric fluctuations. The problem appears in workloads with gradual, sustained load growth: utilization creeps upward inside the 10% band for an extended period, the controller stays quiet, and by the time the threshold is crossed the queue depth is already unacceptable.
Scale-down stabilization. The stabilization window for scale-down defaults to 300 seconds. The controller holds a recommendation window and only acts on the lowest desired replica count observed across that full five-minute span. During a traffic pattern with brief recovery dips, this logic routinely delays scale-down by the full window duration, keeping pods alive and consuming node capacity well past the point of necessity.
Single-pod floor. minReplicas defaults to 1 pod. This protects against cold-start latency but guarantees a baseline cost even when the workload receives zero requests. For a team running dozens of staging namespaces with individual HPAs, that floor accumulates real node pressure overnight.
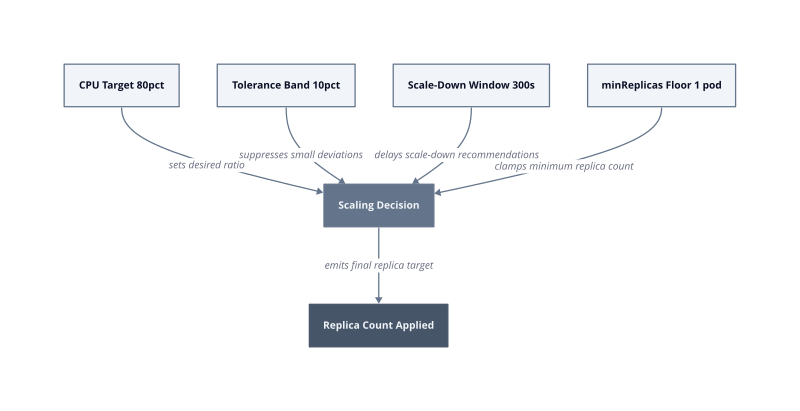
These four defaults compound. Throughout that window, minReplicas of 1 ensures at least one pod persists regardless. No single default is catastrophic in isolation. Together, they produce a controller that is slower to act in every direction than teams expect by the first week of a production incident review.
| Default | Value | Failure condition |
|---|---|---|
| CPU utilization target | 80% | Latency spikes before scale-out fires |
| Cluster-wide tolerance | 10% | Gradual load growth stays unsuppressed too long |
| Scale-down stabilization window | 300 seconds | Idle replicas hold capacity for five minutes post-traffic drop |
| minReplicas | 1 pod | Baseline cost persists at zero traffic without feature-gate changes |
Audit every HPA object against these four values before the next capacity review, specifically in namespaces where resource quotas are tight enough that idle pods block new deployments from scheduling.
Four Configuration Mistakes That Silently Disable Scaling
Four configuration mistakes account for the majority of HPA objects that sit in a cluster, appear healthy, and never fire a single scaling event. Each one breaks a specific link in the pipeline that connects raw kubelet metrics to a replica count decision.
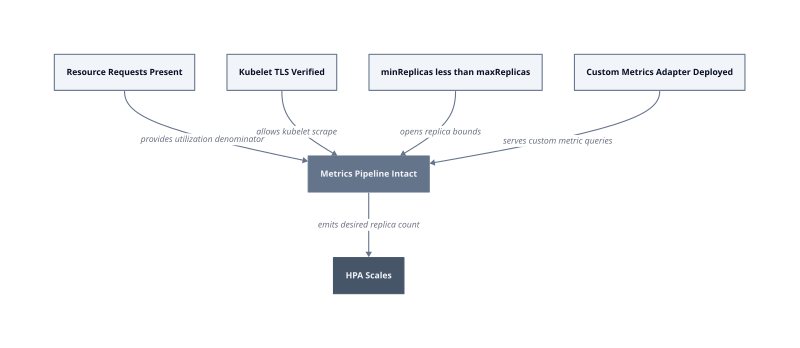
Missing resource requests. Kubernetes resource requests are the denominator the HPA controller uses to compute a CPU or memory utilization percentage (Pod Lifecycle and Resource Requirements). Without a request value on the container spec, the Resource Metrics Pipeline collects raw usage figures from the kubelet but cannot produce a ratio. The controller receives a metric it cannot normalize, treats the utilization as absent, and holds the current replica count. No error surfaces in a human-readable event. The HPA object status shows the metric as unavailable, and teams typically discover this by sprint 3 of a performance investigation, not during the initial rollout.
Metrics-server TLS misconfiguration. The metrics-server queries each node over HTTP to fetch metrics, but in self-managed clusters the kubelet API endpoint uses a self-signed certificate that metrics-server rejects by default. Without --kubelet-insecure-tls, TLS verification fails on every scrape attempt. The metrics-server README documents default resource requests of 100m core of CPU and 200MiB of memory starting from v0.5.0, but those defaults are irrelevant if the process cannot reach the kubelet. The HPA controller enters a ScalingDisabled condition because the aggregated API returns no data. This failure is silent at the workload level and only visible in metrics-server pod logs.
Collapsed minReplicas/maxReplicas range. Setting maxReplicas equal to minReplicas produces a legal HPA object that the API server accepts without complaint. The mechanism is straightforward: the controller computes a desired replica count, then clamps it to the declared bounds. When both bounds are identical, every computed value collapses to that single number. The HorizontalPodAutoscaler v2 API Reference enforces these bounds strictly. Load can double, utilization can exceed any configured target, and the replica count never moves. The fix is to treat these two fields as a range with meaningful separation, not a point with redundant labels.
Absent custom metrics adapter. When an HPA spec references a custom or external metric, the controller sends a query to the aggregated API layer. If no custom metrics adapter is deployed, that endpoint does not exist. This breaks workloads that rely on queue depth, latency percentiles, or any signal outside the CPU and memory the core Metrics API exposes. Deploying Prometheus Adapter or an equivalent before writing the HPA spec prevents this state entirely. It breaks when the adapter is deployed after the HPA object is created but the adapter’s metric discovery rules do not yet match the metric names referenced in the spec.
| Mistake | Broken link | Observable symptom |
|---|---|---|
| Missing resource requests | Utilization ratio undefined | Metric shown as unavailable in HPA status |
| TLS misconfiguration | Kubelet scrape fails | ScalingDisabled condition, metrics-server log errors |
| Collapsed replica range | Bounds clamp all values to one | Replica count static despite utilization changes |
| No custom metrics adapter | Aggregated API returns 404 | HPA enters failed state on every evaluation cycle |
Audit existing HPA objects with kubectl describe hpa across every namespace before the next deployment, specifically checking the Conditions block for ScalingDisabled or FailedGetScale entries.
What HPA Cannot Tell You: Known Gaps and Edge Cases
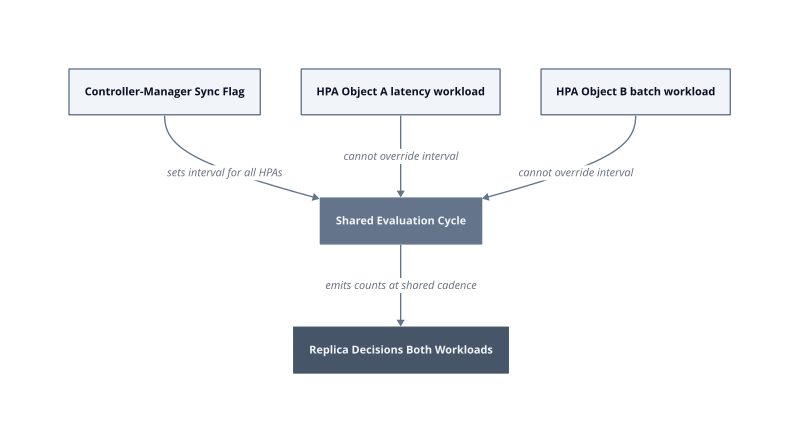
HPA’s control loop ends at the boundary of its own API object, and three gaps sit permanently outside that boundary: sync interval tunability, concurrent scaling controllers, and scale-down behavior when PodDisruptionBudgets constrain pod removal.
The sync interval at which HPA re-evaluates metrics is a cluster-level controller-manager flag, not a per-object field. No field in the HorizontalPodAutoscaler v2 API Reference allows a specific workload to request faster or slower evaluation cycles. Every HPA object in the cluster shares the same poll cadence. Teams running latency-sensitive workloads alongside batch jobs cannot tune one without affecting the other. The stabilization window accepts values from 0 to 3600 seconds, and policy periodSeconds accepts values from 1 to 1800 seconds, but neither controls how frequently the controller wakes up to read metrics. That granularity does not exist at the object level.
KEDA and HPA on the same target. KEDA manages scaling by creating and mutating an HPA object on behalf of a ScaledObject. When a team also applies a native HPA object targeting the same Deployment, two controllers write spec.replicas on the same resource. The mechanism that breaks is Kubernetes reconciliation: both controllers observe a gap between desired and actual state, both issue writes, and the last write wins at any given moment. The result is oscillating replica counts driven by whichever controller’s reconciliation loop ran most recently, not by actual workload demand. KEDA’s documentation recommends removing any native HPA when a ScaledObject is present. This holds as long as KEDA is the sole scaling authority. It breaks if KEDA is later removed without deleting the ScaledObject, because the orphaned HPA it created persists and may hold a stale maxReplicas that caps the workload indefinitely.
PodDisruptionBudget interaction during scale-down. A PodDisruptionBudget defines the minimum number of pods that must remain available during voluntary disruptions. Scale-down by HPA is a voluntary disruption. When HPA computes a lower desired replica count, the actual pod removal is executed by the ReplicaSet controller, which checks PDB constraints before terminating each pod. If the PDB’s minAvailable or maxUnavailable setting leaves no room for removal, the ReplicaSet controller blocks the deletion. HPA does not receive a signal that scale-down was blocked. It records the new desired replica count as the target but the actual count stays elevated. After 30 days of data from production clusters, teams discover this as a persistent gap between desiredReplicas and readyReplicas in HPA status, often misread as a scheduler capacity problem rather than a PDB constraint.
Scale-to-zero prerequisites. minReplicas can be set to 0, but only when the alpha feature gate HPAScaleToZero is enabled and the HPA spec includes at least one Object or External metric (Kubernetes Feature Gates Reference). CPU and memory metrics cannot drive scale-to-zero because those signals disappear once all pods terminate, leaving the controller with no data to trigger scale-out. This works when an external queue-depth metric remains queryable even at zero replicas. It breaks when the metric source itself depends on a running pod, because the controller reads zero metric value as zero load, not as an unavailable signal, and the workload stays at zero replicas indefinitely.
| Gap | Root cause | Detection point |
|---|---|---|
| Sync interval not tunable per object | Controller-manager flag, not HPA field | No per-object override exists |
| KEDA and native HPA conflict | Two controllers write spec.replicas | Oscillating replica counts in events |
| PDB blocks scale-down silently | ReplicaSet respects PDB before HPA desired count | Gap between desiredReplicas and readyReplicas |
| Scale-to-zero with CPU metric | Signal disappears at zero pods | Workload stuck at zero after first scale-down |
The fix for all four gaps follows the same pattern: supplement HPA with a controller that owns the specific decision HPA cannot make. KEDA replaces HPA for external-metric workloads, a dedicated PDB audit in CI prevents unconstrained scale-down blocking, and cluster-level feature gate changes require a cluster operator sign-off, not a per-team HPA edit. Identify which gap applies to each workload before writing the HPA spec, not after the first production scale-down incident.
A Diagnostic Checklist Before You Trust Your HPA
Run these five checks in order before you declare any HPA object production-ready. Each check targets a specific failure mode; skipping one leaves a silent misconfiguration that no Kubernetes event will surface on its own.
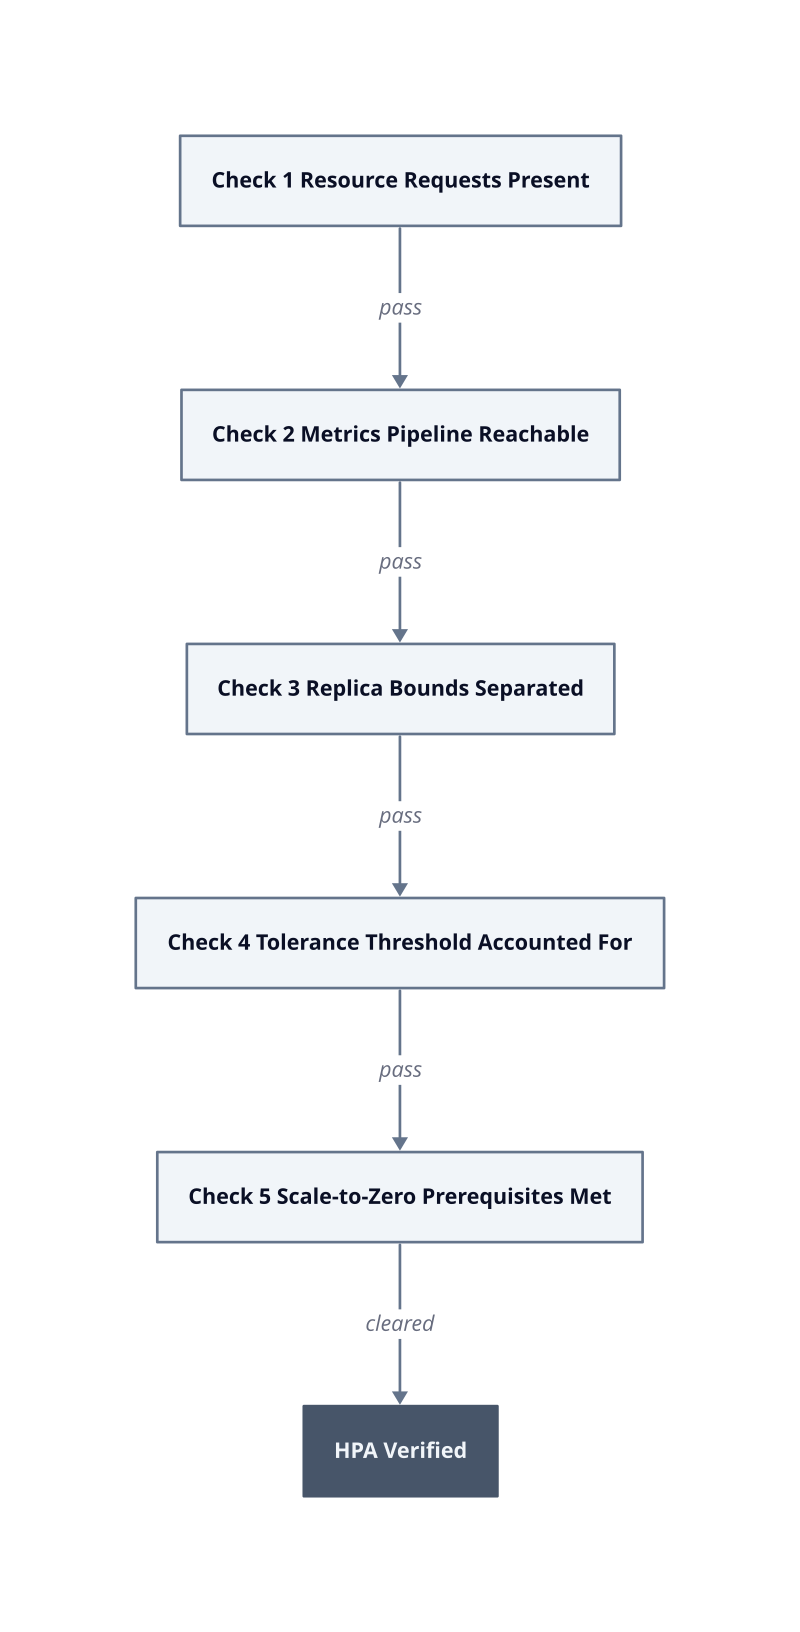
Confirm every container specifies a resource request. Inspect each container in the target Pod spec with kubectl get pod -o jsonpath='{.spec.containers[*].resources.requests}'. An empty result means the metrics pipeline collects raw usage figures but cannot produce a utilization ratio, so the HPA controller marks the metric unavailable and holds the current replica count. This check applies to init containers and sidecar containers as well, because a missing request on any container corrupts the aggregate utilization calculation for the pod. It works in every cluster configuration. It breaks only when a mutating admission webhook injects requests after submission, in which case you must inspect the live pod spec, not the source manifest.
Verify the metrics pipeline returns data. Run kubectl top pods in the target namespace. A working response confirms that metrics-server scraped the kubelet successfully. A Metrics API not available error means TLS verification failed or metrics-server is not installed. The Resource Metrics Pipeline exposes only CPU and memory; if the HPA spec references a custom or external metric, also confirm the custom metrics adapter is registered by checking kubectl api-resources | grep custom.metrics.
Check that minReplicas is strictly less than maxReplicas. Read both fields with kubectl get hpa -o jsonpath='{.spec.minReplicas} {.spec.maxReplicas}'. If the two values are equal, the controller clamps every computed replica count to that single number regardless of observed utilization. Treat any equality as a defect, not a valid steady-state configuration.
Set your utilization target far enough below 100% that normal load variation pushes the ratio outside that band. If no metrics are set, the default metric is 80% average CPU utilization, and traffic patterns that only ever produce utilization within 10% of that target will never trigger a scale-out event because the computed ratio stays inside the tolerance window.
Validate scale-to-zero prerequisites before setting minReplicas to 0. Confirm the HPAScaleToZero alpha feature gate is enabled on the cluster and that the HPA spec includes at least one Object or External metric. CPU and memory metrics cannot support scale-to-zero because those signals vanish once all pods terminate, leaving the controller with no data to initiate scale-out. This check is mandatory the first deployment week for any workload that sets minReplicas: 0.
| Check | Command or field | Failure indicator |
|---|---|---|
| Resource requests present | kubectl get pod -o jsonpath on resources.requests | Empty result per container |
| Metrics pipeline reachable | kubectl top pods | Metrics API not available error |
| Custom adapter registered | kubectl api-resources grep custom.metrics | Resource type absent |
| Replica bounds separated | HPA spec minReplicas vs maxReplicas | Equal values |
| Scale-to-zero prerequisites | HPAScaleToZero gate plus Object or External metric | Gate disabled or only CPU metric present |
Run this checklist against every HPA object the first time it is applied to a namespace, then repeat it after any cluster upgrade that modifies feature gates or controller-manager flags.
