

The Hidden Cost of CPU Limits in Kubernetes
CPU limits in Kubernetes do not cap compute the way most engineers expect: they trigger kernel-level throttling that punishes workloads in bursts, not just at sustained high load. The enforcement mechanism is the Linux Completely Fair Scheduler (CFS) bandwidth controller (Linux Kernel Documentation, sched-bwc.html). Each container receives a quota of CPU time per scheduling period. When the quota is exhausted, the kernel freezes the container’s processes until the next period begins, regardless of whether the host has idle capacity.
That freeze is the source of latency spikes teams routinely misattribute to application bugs, database slowness, or network jitter. The fix is almost always in resource configuration, not in the service itself.
Kubernetes resource requests are the minimum CPU time the scheduler reserves for a pod on a node; limits are the ceiling enforced by the CFS quota mechanism, and the two values operate through entirely separate kernel paths (Kubernetes Docs, manage-resources-containers). Setting a request without a limit does not protect a workload from throttling. It only affects placement. A container with no limit borrows idle CPU freely but imposes noisy-neighbor risk on co-located pods when it spikes.

The runtime mismatch problem compounds this at the application layer. Three patterns appear consistently across production deployments.
JVM over-subscription. The JVM calculates garbage collection thread count and JIT compiler thread count from the host CPU count, not the cgroup quota. A pod limited to 1 CPU on a host with many cores launches GC threads based on the host CPU count, all of which compete for the same throttled quota. The result is GC pauses that dwarf what the heap size alone would predict.
Go GOMAXPROCS mismatch. The GOMAXPROCS variable limits the number of OS threads that execute user-level Go code simultaneously (Go runtime documentation, pkg.go.dev/runtime). Without automaxprocs (uber-go/automaxprocs, GitHub), the runtime defaults to the full host CPU count. When GOMAXPROCS defaults to the full host CPU count rather than the container’s CPU quota, a container throttled to a fraction of the host’s cores spawns far more OS threads than its quota can support, generating context-switch pressure that amplifies every CFS throttle event into cascading goroutine delays.
Node.js event-loop starvation. CFS throttling freezes the process mid-tick. Because Node.js runs a single event-loop thread, one freeze stalls every pending I/O callback simultaneously. Request queuing builds at moderate throughput levels that would never stress a properly configured container.
Pod-level resource limits for CPU, memory, and hugepages are supported starting in Kubernetes 1.37 (Kubernetes Docs, manage-resources-containers). Teams on earlier versions are constrained to container-level settings, which means a multi-container pod cannot express a shared CPU budget. Audit your cluster version before designing a limit strategy.
How CPU Units and Throttling Actually Work
The Linux Completely Fair Scheduler enforces CPU limits not as a rate cap but as a hard quota per fixed time window, and that distinction determines everything about how container workloads behave under pressure.
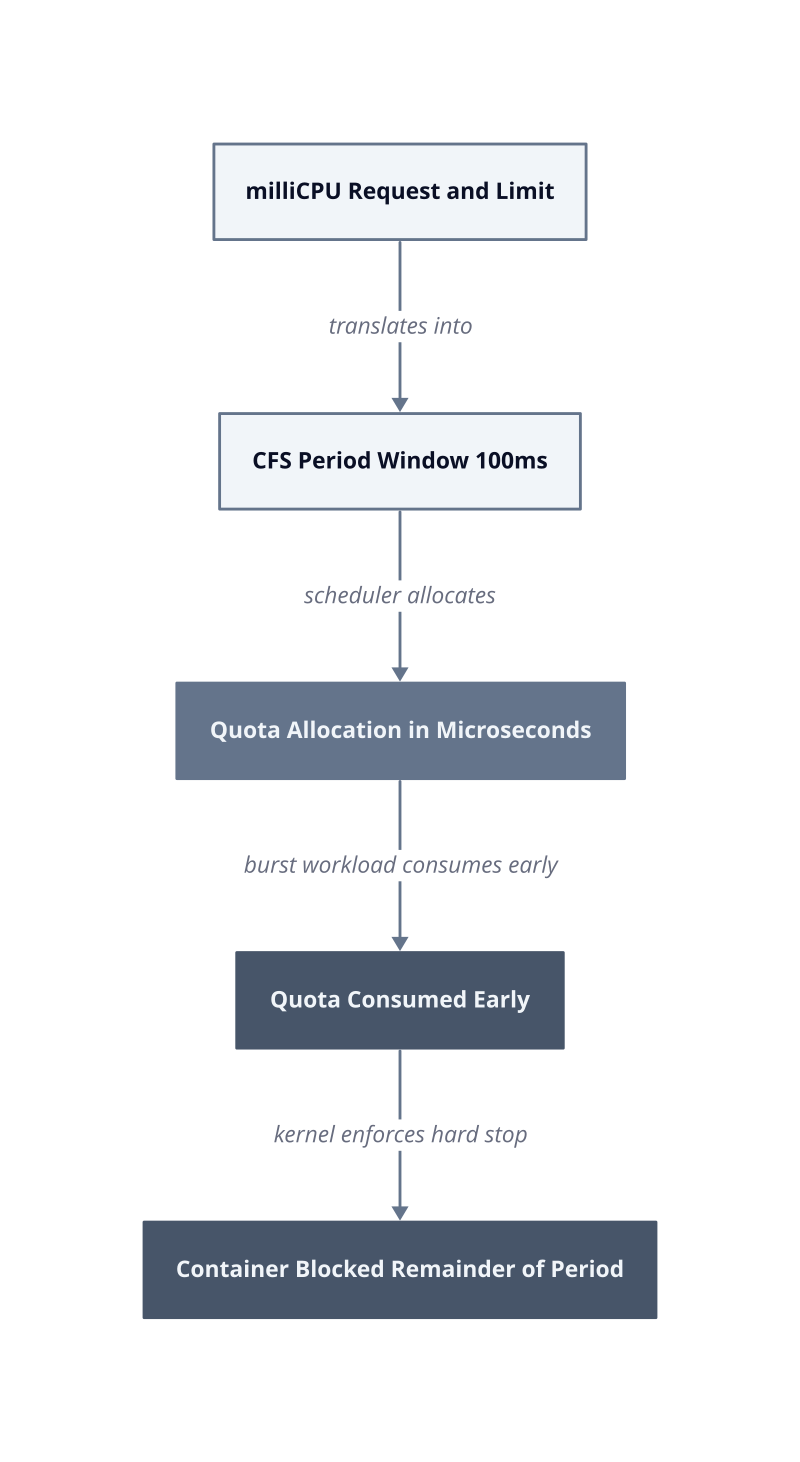
A milliCPU is a thousandth of one CPU core’s compute capacity over a scheduling period. Kubernetes expresses CPU resources in these units specifically because the CFS scheduler operates on time fractions, not on core assignment. When you write 500m in a container spec, you are telling the kernel to allow that container to consume 50 milliseconds of CPU time within each 100-millisecond period (Linux Kernel Documentation, sched-bwc.html). The container does not own half a core. It owns half a period.
That period length matters. The default value for cpu.cfs_period_us is 100ms (Linux Kernel Documentation, sched-bwc.html). Within each period, the kernel tracks microsecond-granular accounting: a task group is allocated up to its quota of microseconds of CPU time, then blocked until the period resets. A burst workload that consumes its full quota early in the period sits frozen for the remainder of that period, even when every other core on the host is idle, because throttled threads cannot run again until the next period when the quota is replenished (Linux Kernel Documentation, docs.kernel.org/scheduler/sched-bwc.html). No application-layer queue, retry, or circuit breaker addresses this condition.
The distinction between requests and limits operates through separate kernel mechanisms. Requests feed the scheduler’s bin-packing logic at pod placement time. Limits feed the CFS bandwidth controller at runtime. The two values never interact after a pod lands on a node.
| Concept | Kernel Mechanism | Failure Mode |
|---|---|---|
| CPU request | Scheduler weight, not enforced at runtime | Noisy-neighbor contention when no limit is set |
| CPU limit | CFS quota per 100ms period | Throttle freeze on any burst above the quota |
| milliCPU unit | Fraction of one period’s microseconds | Misconfigured values produce invisible latency |
Requests without limits. A container with a request but no limit borrows whatever idle CPU is available on the node. This works until a co-located workload spikes. Because Kubernetes only enforces burst headroom through limits, not requests alone, a node under load distributes CPU by weight, not by guarantee. The container that looked unconstrained in a quiet cluster gets starved without a single throttle event appearing in metrics.
Pod-level resource accounting. CPU limits in Linux are enforced by CPU throttling via the kernel (Kubernetes Docs, manage-resources-containers). Starting in Kubernetes 1.37, pod-level resource requests and limits for CPU, memory, and hugepages are supported (Kubernetes Docs, manage-resources-containers). Before 1.37, every container in a pod carries its own independent quota, and the pod has no aggregate budget. A pod with three sidecar containers each capped at 500m burns three separate quota pools, which changes throttle behavior compared to a single 1500m limit on the pod.
Verify your cluster version before writing any limit strategy. If you are below 1.37, design container-level limits with explicit accounting for every sidecar, including service meshes injected automatically by admission controllers.
Runtime-Specific Failures: Java, Go, and Node.js
Each major runtime carries a built-in assumption about available CPU that cgroup isolation breaks in a distinct way, producing failure modes that look different in metrics but share one root cause: the runtime read the wrong CPU count at startup.
The mechanism is consistent across runtimes. At process initialization, the runtime queries the host environment for logical CPU count. Before cgroup-aware defaults were common, that query returned the full host topology. A container limited to a fraction of the host’s cores would, without cgroup awareness, initialize as if it owned all of the host’s logical CPUs. Everything sized against that number, from thread pool depth to GC worker count, was wrong before the first request arrived.

JVM GC over-subscription. OpenJDK calculates garbage collection thread count and JIT compiler thread count from the detected CPU count. A pod capped at a single CPU that launches more GC threads than its quota can sustain causes those threads to compete with each other inside the CFS quota. Every GC cycle consumes the period’s quota faster, freezing application threads for the remainder. Pause times grow not because the heap is full but because the quota is exhausted.
Go goroutine thrashing. The Go runtime selects default GOMAXPROCS as the minimum of the logical CPU count, the CPU affinity mask count, or the cgroup CPU throughput limit, where the throughput limit equals the cgroup CPU quota divided by the period (Go runtime documentation, pkg.go.dev/runtime). On Linux, the Go runtime determines the default GOMAXPROCS by checking the process’s average CPU throughput limit based on cgroup CPU quota (Go runtime documentation, pkg.go.dev/runtime). This means a correctly configured cgroup produces a correct GOMAXPROCS automatically. The failure mode is teams deploying to environments where the cgroup quota is not set, or where the Go runtime version predates this awareness. In those cases, GOMAXPROCS defaults to the full host CPU count. A container throttled to a fraction of the host’s cores, but running OS threads scaled to the full host CPU count, generates context-switch pressure that turns every CFS throttle event into a queue of blocked goroutines, amplifying latency across all concurrent requests.
Node.js event-loop starvation. Node.js runs a single event-loop thread. CFS throttling does not distribute a freeze across multiple threads because there is only one. When the quota exhausts mid-tick, the kernel freezes that thread until the next period. Every pending I/O callback, timer, and incoming request waits behind a single blocked thread. Latency spikes appear at moderate throughput levels that would never stress a multi-threaded process. Setting very low CPU limits on a Node.js container means the CFS period freeze duration grows relative to tick execution time, and request queuing accumulates after just a few consecutive throttle events.
| Runtime | Root Cause | Observable Symptom |
|---|---|---|
| JVM pre-Java 15 | GC threads sized from host CPU count | GC pauses exceeding heap-size prediction |
| Go without cgroup quota set | GOMAXPROCS defaults to host CPU count | Goroutine context-switch pressure under throttle |
| Node.js with low CPU limit | Single thread frozen by CFS mid-tick | Request queue buildup at moderate load |
| JVM Java 15 plus with manual flag overrides | cgroup awareness bypassed by explicit flags | Same over-subscription as pre-Java 15 |
The Java 15 cgroup detection improvement is a guardrail, not a guarantee. Audit every -XX: flag in your JVM startup arguments by sprint 3 of any container migration. A single overridden thread count flag silently undoes what the runtime fixed automatically.
The Noisy-Neighbor Problem: Requests Without Limits
A CPU request without a limit is not a conservative setting. It is an open lease on every idle cycle on the node, and that lease gets revoked without warning when a neighbor spikes.
Kubernetes resource requests are the scheduler’s input for bin-packing decisions: the value determines which node receives the pod, not how much CPU the pod receives at runtime. Once the pod lands, the request has no enforcement role. The kernel does not throttle a container that exceeds its request. It only throttles a container that exceeds its limit. Remove the limit, and the container runs unconstrained until the node runs short.
The mechanism behind noisy-neighbor interference is CPU share weighting under CFS. When multiple containers compete for a contested node, the kernel distributes CPU time proportionally to their request values, treated as relative weights. A container with no limit set borrows freely during idle periods. When a neighboring workload spikes and claims its weighted share, the borrowing container gets cut back to its request-weighted allocation. That cut is not a throttle event in the conventional sense. No container_cpu_cfs_throttled_seconds_total counter increments. The container simply receives less time. Latency rises invisibly, and the metrics dashboard shows nothing actionable.
CPU limits in Linux are enforced by CPU throttling via the kernel (Kubernetes Docs, manage-resources-containers). Requests carry no equivalent enforcement path. The two values operate through separate kernel mechanisms that never interact after pod placement. Designing a limit strategy that relies on requests alone conflates placement policy with runtime policy.

| Signal | With CPU Limit | Without CPU Limit |
|---|---|---|
| Throttle counter fires | Yes, on quota exhaustion | No, borrowing is not throttling |
| Neighbor spike visibility | Isolated by quota boundary | Directly degrades your container |
| Latency attribution | CFS throttle metric | Invisible - appears as slow requests |
| Node eviction risk | No CPU-based eviction | No CPU-based eviction |
Silent degradation. Teams that deploy without CPU limits read clean throttle metrics and conclude the container is healthy. The actual failure mode is a 40-millisecond stall that appears as elevated p99 latency because the kernel reallocated CPU shares to a neighbor. No alert fires. No throttle metric increments. Over an extended observation period, the pattern shows p99 correlation with neighboring pod activity, not with internal workload volume.
Burst interference at the period boundary. Kubernetes only guarantees burst headroom through limits, not requests alone (Kubernetes Docs, manage-resources-containers). Without a limit, every CFS period is a fresh competition. A burst-heavy neighbor that exhausts its own quota mid-period stops consuming, and the reclaimed time gets redistributed. The unlimit container picks it up. Then in the next period, the neighbor bursts again. The result is erratic CPU availability that no application-level queue management addresses because the variation occurs below the syscall layer.
Admission control failure. Cluster autoscaler and the scheduler both use requested resources to calculate node capacity. A node that appears to have 4 CPUs of headroom based on requests hosts containers that are actually consuming 6. When you add limits later, containers that ran fine under relaxed conditions start throttling immediately. The limit did not break them. The limit revealed they were already over-provisioned against actual capacity.
The fix is to treat a missing CPU limit as a policy violation, not a tuning deferral. Pod-level resource requests and limits for CPU, memory, and hugepages are supported starting in Kubernetes 1.37 (Kubernetes Docs, manage-resources-containers). Enforce a LimitRange object in every namespace that sets a default CPU limit. A pod that lands without an explicit limit gets a conservative default rather than an open lease.
Practical Recommendations for Setting CPU Limits Safely
Safe CPU limit configuration is not a single knob. It is a per-runtime checklist executed in a specific order, because the failure mode for each runtime follows from how that runtime reads its environment at startup.
The kernel enforces CPU limits through CFS throttling (Kubernetes Docs, kubernetes.io/docs/concepts/configuration/manage-resources-containers). Memory limits take a different enforcement path, using OOM kills (Kubernetes Docs, kubernetes.io/docs/concepts/configuration/manage-resources-containers). These two mechanisms are independent. A container can be memory-safe and CPU-throttled simultaneously, and the symptoms look nothing alike. Conflating the two during tuning produces fixes that address the wrong resource.

That detection is the baseline. The fix is to audit every -XX:ParallelGCThreads, -XX:CICompilerCount, and -XX:ActiveProcessorCount flag in your startup arguments before setting the CPU limit. Any manually specified thread count overrides the cgroup detection silently. Set the CPU limit first, then remove manual thread overrides and let the JVM calculate from the quota. This works when you run Java 15 or later. For those versions, calculate thread counts manually from the quota value and pin them explicitly.
Go: set the cgroup quota or add automaxprocs. The Go runtime selects default GOMAXPROCS from the process CPU affinity mask and the cgroup CPU throughput limit (Go runtime documentation, pkg.go.dev/runtime). The throughput limit equals the cgroup CPU quota divided by the period. A correctly configured cgroup produces a correct GOMAXPROCS without any additional library. The failure condition is a missing cgroup CPU quota. When the quota is absent, GOMAXPROCS defaults to the full host CPU count, and a container throttled to a fraction of the host’s cores runs with far more OS threads than its quota can support, generating context-switch pressure on every CFS throttle event. The fix for environments where you cannot set a cgroup quota is to import uber-go/automaxprocs (github.com/uber-go/automaxprocs), which reads the cgroup quota at startup and sets GOMAXPROCS accordingly. Import it and the problem is resolved in the first deployment week.
Node.js: the floor matters more than the ceiling. Node.js runs a single event-loop thread. CFS throttling freezes that one thread for the remainder of the quota period. Setting a limit below 1 CPU means the freeze duration grows relative to individual tick execution time. Request queuing accumulates after a small number of consecutive throttle events, not after sustained high load. The fix is to treat 1 CPU as the minimum CPU limit for any Node.js container serving live traffic. This works for standard Express or Fastify workloads. It breaks for CPU-intensive workloads like image processing or tight synchronous computation, where even 1 CPU produces measurable queue buildup. Those workloads need profiling to identify the tick duration, then a limit sized to prevent the quota from exhausting mid-tick.
| Runtime | Minimum Safe CPU Limit | Configuration Action | Breaks When |
|---|---|---|---|
| Java 15 plus | Sized to quota, not host | Remove manual XX thread flags | Any XX flag overrides cgroup-detected count |
| Java 14 or earlier | Sized to quota, not host | Pin thread counts to match quota manually | Quota changes without flag update |
| Go with cgroup quota set | Any value with quota defined | No extra library needed | Quota is missing from cgroup config |
| Go without cgroup quota | Any value | Add automaxprocs at process init | Library import is omitted from build |
| Node.js | 1 CPU minimum | No flag change needed | Tick contains CPU-bound synchronous work |
Pod-level resource requests and limits for CPU, memory, and hugepages are supported starting in Kubernetes 1.37 (Kubernetes Docs, kubernetes.io/docs/concepts/configuration/manage-resources-containers). Use that pod-level limit field to express a single authoritative resource budget per pod rather than per container when your pod contains a primary runtime and a sidecar proxy. Sizing the sidecar at a separate container limit prevents proxy CPU consumption from throttling the application thread during high-ingress periods.
Start with the runtime check: confirm the Java version, confirm the cgroup quota is set for Go, and confirm the Node.js limit floor. Every other tuning decision builds on those three facts.
