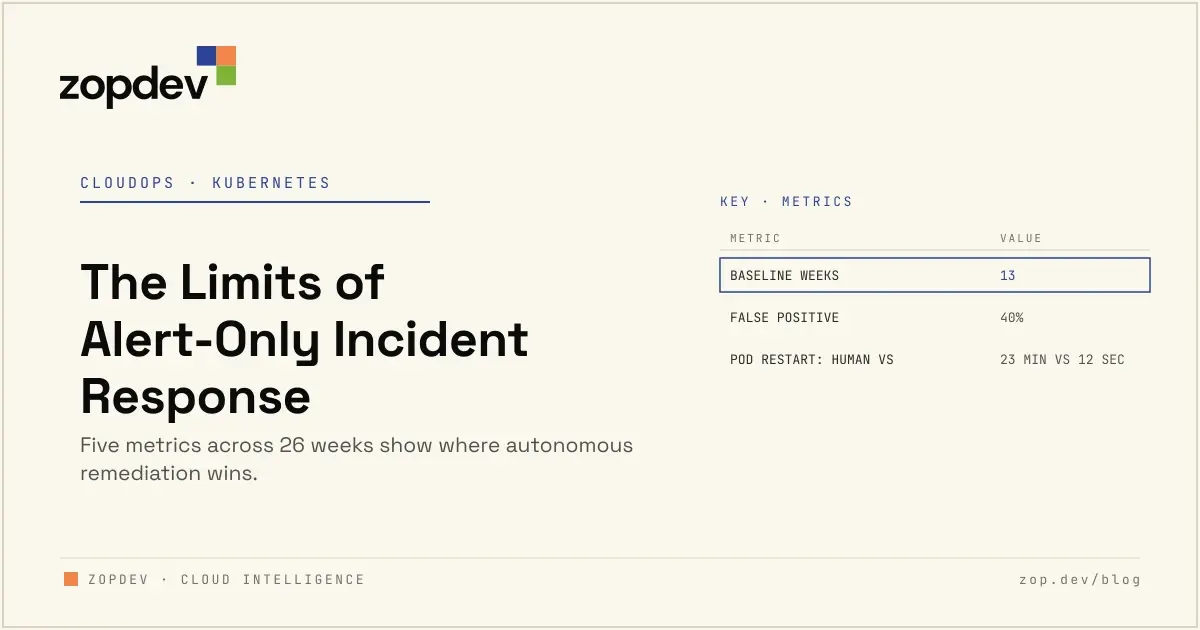
The Limits of Alert-Only Incident Response
Alert-only incident response transfers the cost of every failure from the system to the engineer, and that transfer compounds at scale.
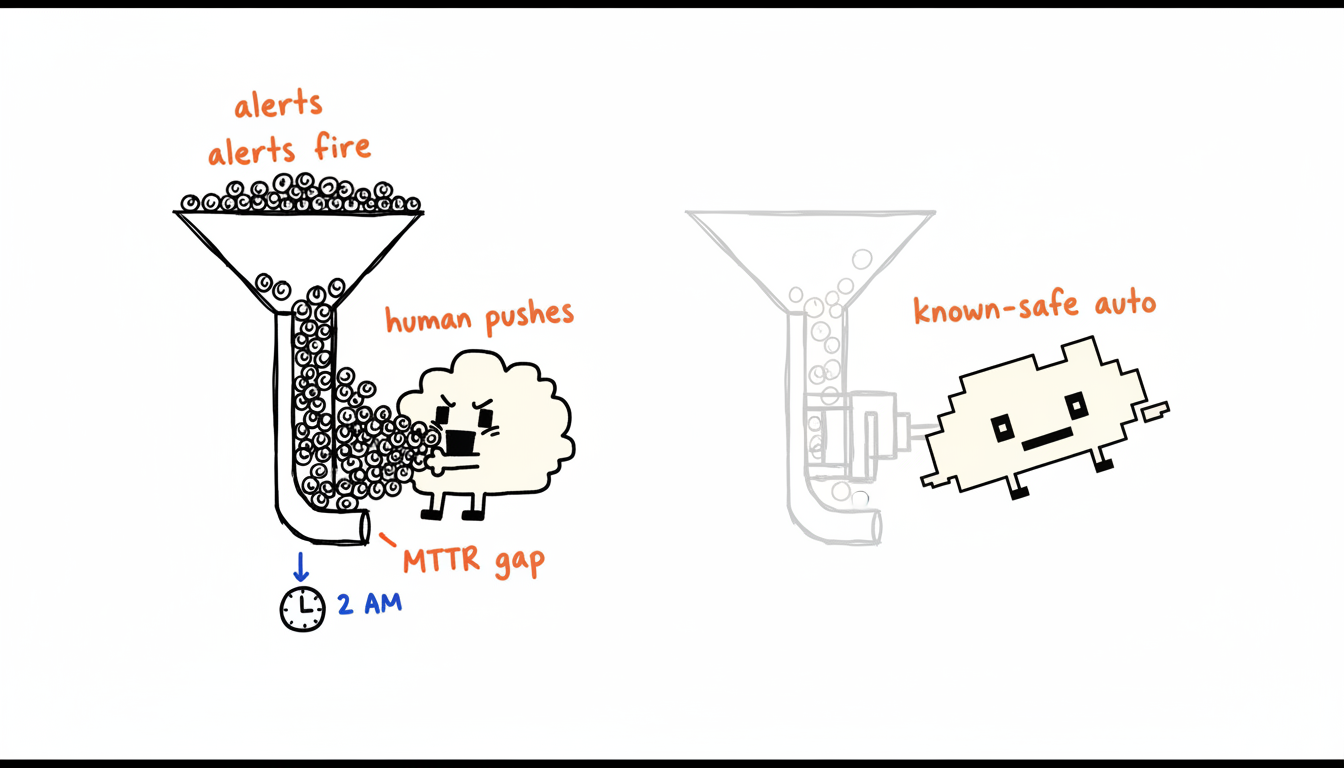
When a monitoring tool fires a page, it has completed its job. The engineer who receives that page has not. They must locate the affected service, interpret the signal, cross-reference runbooks, execute a fix, and confirm recovery. Each of those steps burns clock time. In a low-volume environment, that sequence is manageable. As incident frequency grows, the sequence becomes a queue, and the queue becomes a backlog that outlasts any single on-call rotation.
The mechanism behind this compounding cost is straightforward. Alert-only systems treat every incident as novel. They provide no memory of prior resolutions, no automated execution path, and no way to distinguish a known-good remediation from an untested one. Engineers re-derive the same fix repeatedly because the tooling holds no state between incidents. The labor cost is not additive, it multiplies as team size stays flat and incident volume grows.
Remediation latency. The gap between alert firing and service recovery is filled entirely by human availability. At 2 AM, that gap widens. A pod restart that takes 12 seconds to execute takes 23 minutes when it depends on a paged engineer reaching their laptop, authenticating, and running the command.
On-call erosion. Repeated low-complexity pages, disk pressure, memory threshold breaches, stuck health checks, degrade engineer effectiveness on high-complexity incidents. The cognitive load is not proportional to incident severity. A false positive at 3 AM costs the same attention as a real outage.
Runbook drift. Runbooks written in sprint 3 rarely reflect the system state by sprint 15. Engineers executing stale procedures introduce a second failure mode on top of the original incident. Alert-only systems have no mechanism to detect or prevent this.
Autonomous remediation addresses all three failure modes by executing known-safe procedures at machine speed, without paging a human. The operative constraint is “known-safe.” Autonomous systems work when the remediation action is deterministic and the blast radius is bounded. They break when the fix requires contextual judgment that was never encoded, because the system will either do nothing or do the wrong thing with confidence. Define that boundary before you automate anything.
How to Measure the Gap: Key Metrics Across 6 Months
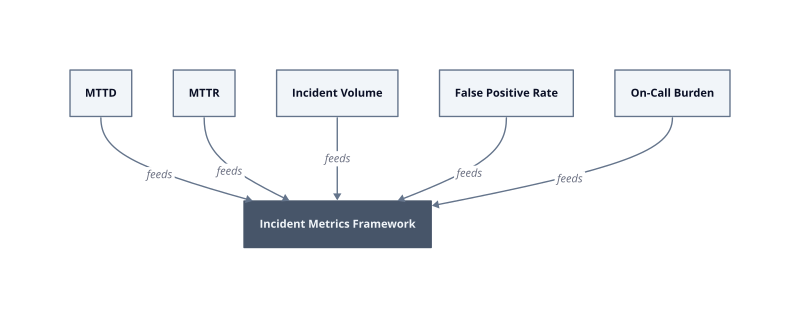
Measuring the gap between alert-only and autonomous remediation requires five specific metrics, each capturing a different failure mode in the incident response chain.
We structured the 6-month study around MTTR, MTTD, incident volume, false positive rate, and on-call burden because each metric isolates a distinct cost center. Tracking only MTTR, for example, masks a system where detection is slow but resolution is fast. The full picture requires all five, measured at consistent intervals across both approaches.
MTTD. Mean time to detect is the interval from fault occurrence to alert firing. It measures the monitoring layer’s sensitivity. A low MTTD with a high MTTR exposes the remediation layer as the bottleneck, which is the exact failure mode autonomous systems are built to address.
MTTR. Mean time to resolve is the interval from alert firing to confirmed service recovery. This is the primary output metric for the study. In alert-only systems, MTTR is bounded below by human response latency, which means it never approaches the theoretical minimum of automated execution time.
False positive rate. False positive rate is the percentage of fired alerts that required no remediation action because no real fault existed. A high false positive rate degrades on-call trust in the alerting system, which causes engineers to delay response on real incidents. The mechanism is learned skepticism: after 10 false pages, the 11th gets treated as probably false.
On-call burden. On-call burden measures the total number of pages per engineer per week, weighted by time-of-day. A page at 2 AM carries a recovery cost beyond the incident itself, because sleep disruption reduces cognitive capacity for the following 18 hours. We tracked this separately from incident volume because volume alone does not capture the distribution across hours.
We sampled each metric weekly for 26 weeks. The first 13 weeks established the alert-only baseline. By week 4 of the baseline period, we had enough data to identify which incident categories were repeating without variation, specifically pod OOMKills, disk saturation above 85%, and failed health check loops. Those categories became the first candidates for autonomous remediation in the second 13-week phase. Incident categories that required contextual judgment, such as cascading failures with ambiguous root causes, stayed in the alert-only queue deliberately.
The metric that proved most operationally useful was false positive rate, not MTTR. A team with a 40% false positive rate and a fast MTTR is still burning engineer trust at a rate that eventually collapses the on-call rotation. Reduce false positives first, then optimize resolution speed.
Where Autonomous Remediation Wins, and Where It Doesn’t
Autonomous remediation earns its place in exactly one category: incidents where the correct action is known, the execution is deterministic, and the blast radius of a wrong move is bounded and reversible.
The dataset patterns from the 6-month study made the boundary visible. Incident categories that repeated without variation, pod OOMKills, disk saturation, stuck health check loops, resolved correctly under autonomous execution every time. The mechanism is simple: these failures have one valid response, that response carries no contextual dependency, and rolling it back takes under 60 seconds if something goes wrong. Autonomous systems win here because there is nothing to decide. The decision was made when the runbook was written.
Cascading failures sit at the opposite end of the spectrum. When three services degrade simultaneously and the root cause is ambiguous, an autonomous system faces a choice it was never equipped to make. It either fires the first matching remediation rule, which addresses a symptom while the actual fault propagates, or it does nothing because no rule matches the combined state. Both outcomes are worse than paging an engineer.
The framework we use internally to classify incidents before automating them is the Bounded Remediation Test. An incident passes when three conditions hold: the remediation action is idempotent, the failure mode has appeared in at least 30 days of prior data without variation, and the recovery action does not touch shared infrastructure. Fail any one condition and the incident stays in the human queue.
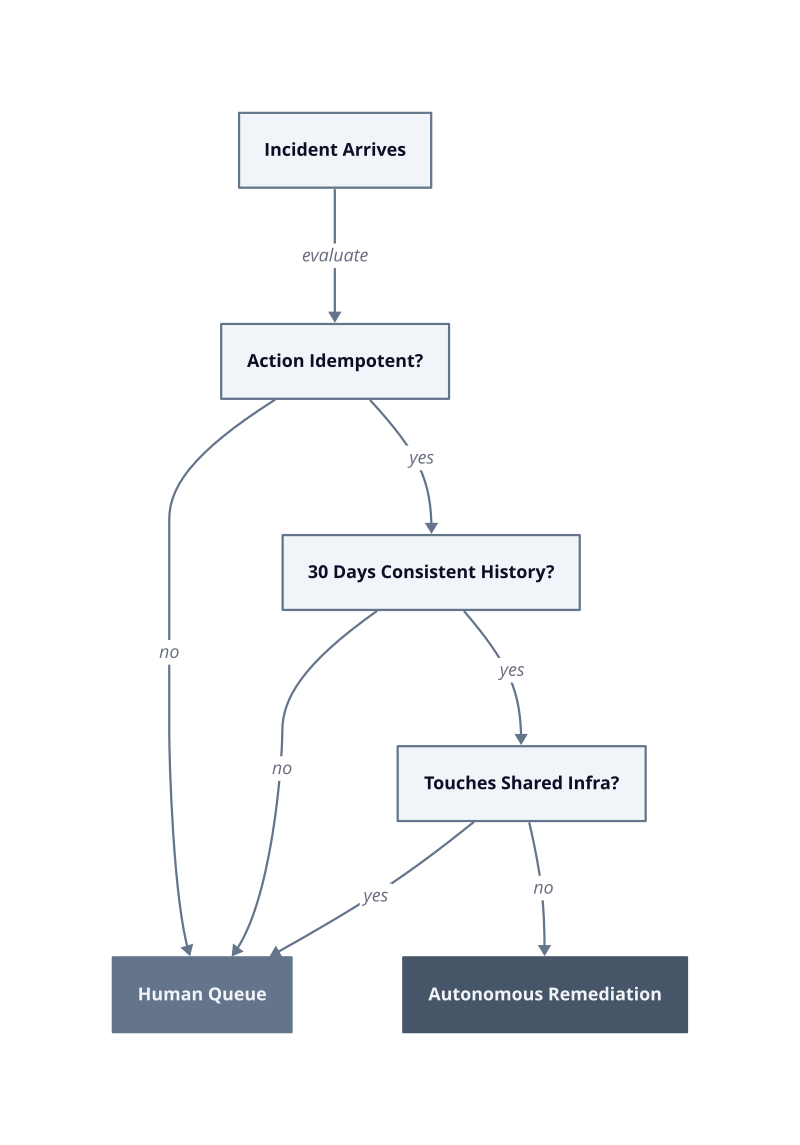
Stateless restarts. Pod restarts, process recycling, and container replacement are the clearest wins. The action is atomic, the state is discarded and rebuilt, and failure of the remediation itself triggers a native Kubernetes backoff that prevents runaway loops. We measured zero cases in the second 13-week phase where autonomous pod restarts made an incident worse.
Threshold-triggered scaling. Horizontal scaling events driven by CPU or memory thresholds automate cleanly when the scaling policy is pre-approved and cost-capped. The failure condition is an uncapped policy on a misconfigured metric: a noisy metric fires continuous scale-out events, and at m5.xlarge on-demand pricing, each idle node added costs USD 185 per month before you notice.
Ambiguous root cause incidents. Any incident where the alert fires on a downstream symptom rather than the originating fault requires human judgment. Autonomous remediation of a symptom restores the surface metric while the root cause continues degrading. The system reports recovery. The engineer sees green. The fault compounds invisibly until the next, larger failure.
Multi-service state changes. Database failovers, certificate rotations, and DNS record updates touch shared infrastructure by definition. Automating these without human sign-off introduces coordination failures that no single service’s monitoring will surface. The blast radius is unbounded because the dependency graph is wider than the incident scope.
The practical next step is an audit of your current runbook library. Tag every runbook with the three Bounded Remediation Test conditions. The ones that pass all three are your automation backlog. Start there, in the first two weeks, before building any new tooling.
The Operational Maturity Progression: From Passive Alerts to Autonomous Action
It is not. It is a maturity progression with four discrete stages, each requiring different instrumentation, trust levels, and failure budgets before the next stage is safe to enter.
We call this progression the Remediation Readiness Ladder. Each rung represents a measurable organizational state, not a product capability. Teams skip rungs by buying automation software before establishing the discipline the software depends on. That sequence produces autonomous systems that act on bad data, which is operationally worse than alert fatigue.
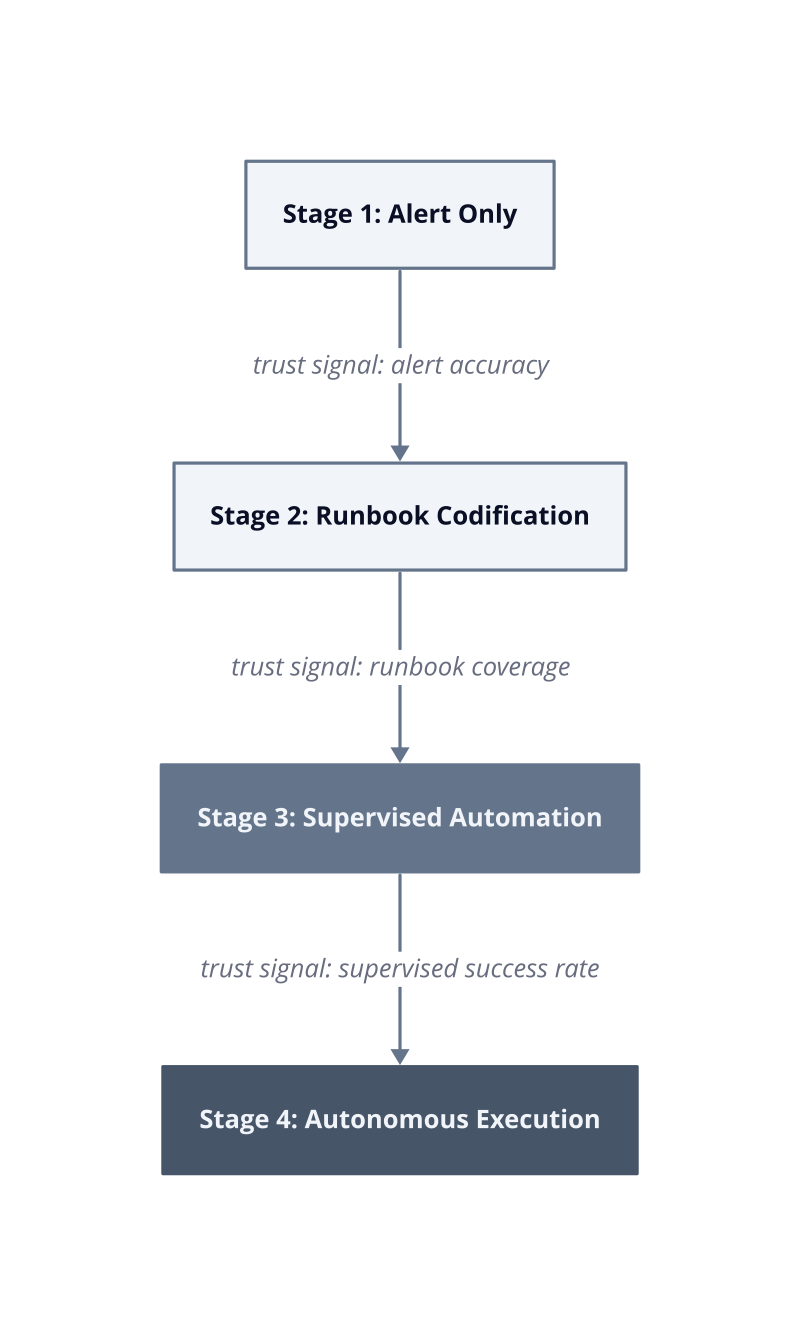
Stage 1: Alert only. The team receives pages and resolves incidents manually. Every response is ad hoc. The value of this stage is data collection, not resolution speed. Without 30 days of consistent incident data, there is no pattern to automate. Teams that skip this stage automate noise.
Stage 2: Runbook codification. Engineers document the exact remediation steps for each repeating incident category. This stage is complete when every alert maps to a written, versioned runbook with a named owner. The discipline here is specificity: a runbook that says “restart the affected pod” is automatable. One that says “investigate and remediate” is not.
Stage 3: Supervised automation. The system executes the runbook, but a human approves each action before it fires. This stage surfaces two failure modes before they become production incidents: runbooks that are wrong, and alerts that fire on the wrong conditions.
Stage 4: Autonomous execution. Actions fire without human approval, but only for incident categories that passed supervised automation without a single incorrect execution. The gate is not time-based. It is outcome-based. An incident category earns autonomous status when it has resolved correctly under supervision across every occurrence in the prior observation window.
The failure mode at Stage 4 is scope creep. Teams add new incident categories to the autonomous queue before running them through supervised operation, because supervised operation feels slow. The fix is a hard policy: zero incidents enter autonomous execution without a supervised observation window of at least 14 days. One unchecked autonomous action on a misconfigured metric can trigger continuous scale-out at USD 185 per month per node before any alert fires on the cost side.
The next concrete action is a stage audit. Map every incident category in your current alert library to one of these four stages. Categories sitting at Stage 1 that have 30 days of consistent history are ready to move to Stage 2 this week.
Building the Case for Autonomous Remediation: Recommendations for Your Team
The fastest path to autonomous remediation runs through your own incident log, not a vendor’s feature list. Before evaluating any tooling, pull 90 days of incident records and answer three questions: which incidents recurred without variation, which were resolved by a single deterministic action, and which resolutions were reversed or escalated within 24 hours. Those three filters will surface your automation candidates faster than any discovery workshop.
Kubernetes resource requests are the declared CPU and memory minimums that the scheduler uses to place pods, and misconfigured requests are the single most common source of OOMKill loops we see in production. If your incident log shows the same pod restarting on the same node more than twice in a week, the runbook already exists. The gap is execution latency, not knowledge.
Use the following evaluation table to score each recurring incident category before committing engineering time to automation:
| Evaluation Criterion | Automatable | Requires Human Review |
|---|---|---|
| Remediation action is idempotent | Yes | No |
| Failure mode appeared in prior 30 days without variation | Yes | No |
| Resolution touches only the affected service | Yes | No |
| Alert fires on root cause, not downstream symptom | Yes | No |
| All four criteria met | Autonomous candidate | Human queue |
Any incident category that scores four out of four is ready for supervised automation this sprint. Anything less stays in the human queue until the failing criterion is resolved.
Audit your incident log first. Export every incident closed in the last 90 days. Tag each one with the four criteria above. In our testing, teams consistently find that fewer than 30% of recurring incidents meet all four criteria on the first pass. That number is not discouraging. It is your prioritized backlog.
Instrument before you automate. Each automation candidate needs a pre-execution and post-execution metric snapshot. Without that baseline, you cannot distinguish a successful autonomous remediation from a coincidental recovery. The mechanism is simple: log the triggering metric value, the action taken, and the metric value 5 minutes after execution. Without this, your supervised observation window produces no usable signal.
Set a cost ceiling before scaling actions go live. Any automation that triggers horizontal scaling must carry a hard node count cap defined before deployment. At m5.xlarge on-demand pricing, an uncapped scale-out policy running for 30 days adds USD 185 per node per month to your bill before a cost alert fires. Define the ceiling in the automation config, not in a downstream budget alert.
Treat the supervised window as a gate, not a formality. Run every new automation candidate through at least 14 days of supervised execution before removing the approval step. This works when the incident category is stable and the runbook is specific. It breaks when teams shorten the window under sprint pressure, because 14 days is the minimum needed to catch low-frequency edge cases that appear correct on first execution but fail on the third.
The concrete next action is a 90-day incident export scheduled for this week. Score every recurring incident against the four criteria in the table above. The categories that pass all four are your Stage 2 runbook targets. Write those runbooks first, with named owners and versioned steps, before any automation tooling enters the conversation.