
The Alert Fatigue Trap: Why PagerDuty Alone Isn’t Enough
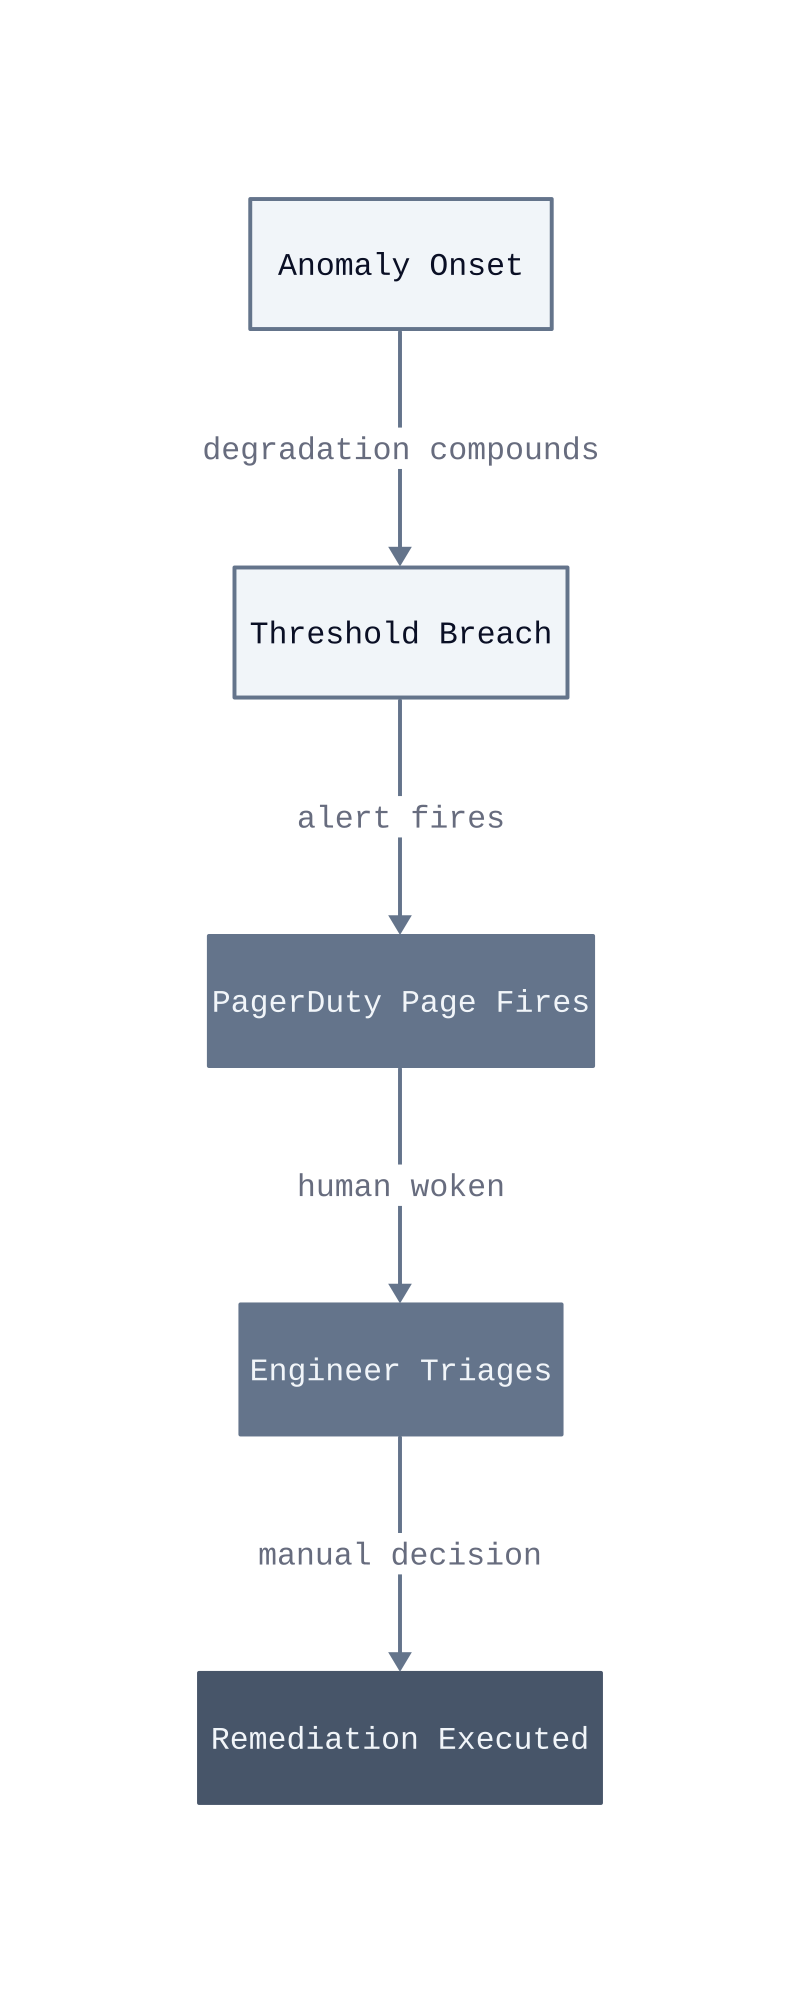
Reactive alerting pipelines fail not because the tools are broken, but because the model is wrong. PagerDuty does exactly what it was designed to do: notify a human when a threshold is crossed. The problem is that threshold-crossing is already a late signal. By the time a metric breaches the alert boundary, the degradation has been compounding for minutes, sometimes longer. A human then receives a page, interprets context, decides on an action, and executes it. That sequence introduces latency the system cannot afford.
The mechanism behind burnout is structural, not personal. On-call engineers are placed at the end of a detection pipeline that was never designed to reduce their workload. Every alert that fires is a problem the automated layer failed to absorb. When alert volume grows faster than the team’s capacity to triage, engineers begin suppressing notifications, delaying responses, or applying blunt remediations without full diagnosis. Each of those behaviors increases the probability of a secondary incident.
Late signal problem. Alerting thresholds are set against observed steady-state metrics. An anomaly that develops gradually, CPU creep, memory fragmentation, connection pool exhaustion, stays below the threshold until the system is already stressed. The alert fires after damage accumulates, not before it starts.
Human-in-the-loop latency. Every step between page receipt and remediation execution requires a decision. Engineers must correlate the alert with recent deployments, check dependent services, and choose a safe action. In a degraded system, that process routinely takes longer than the incident’s blast radius allows.
Suppression as a failure mode. When alert volume exceeds triage capacity, engineers route low-priority pages to silence. The suppressed alerts are not resolved. They are deferred. Deferred problems compound, and the next threshold breach arrives with less context and less time to act.
The closed-loop model inverts this pipeline. Automated systems detect the anomaly at onset, before the threshold fires, and execute a pre-validated remediation without waiting for a human decision. PagerDuty becomes the fallback for cases the automation could not resolve, not the first line of response. Start by auditing the last 30 days of incident logs: count how many pages fired on metrics that had been trending toward breach for more than five minutes. That number is the automation opportunity.
What Closed-Loop AIOps Actually Means
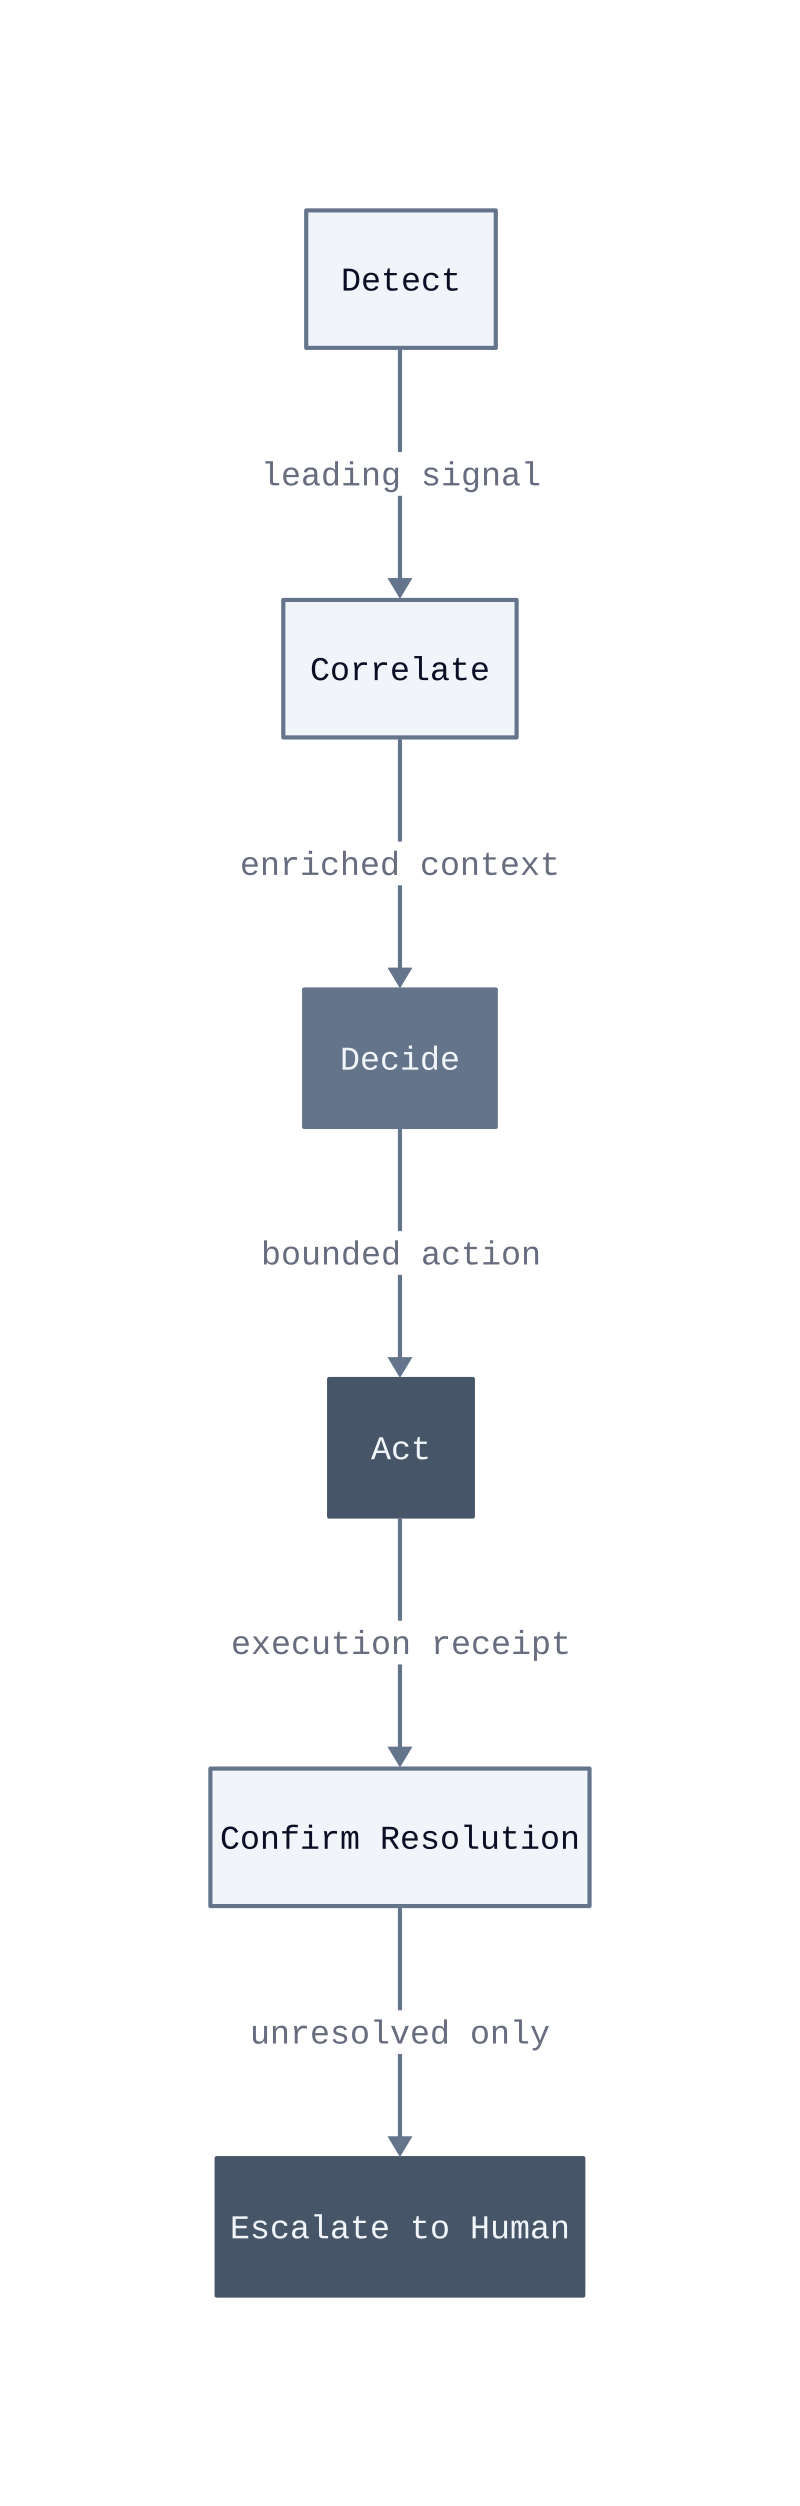
A closed-loop AIOps system is one where detection, correlation, decision, and action execute in sequence without a human in the critical path. That definition excludes most tools marketed as AIOps today. Platforms that surface anomaly scores, group related alerts, or recommend runbooks still terminate at a human decision point. The loop is open. A closed loop means the system writes back to the infrastructure, not just to a dashboard.
The four-stage cycle works as follows. Detection fires on leading indicators, not threshold breaches. Correlation maps the detected signal against topology, recent change events, and dependent service state. Decision selects a pre-validated remediation action from a bounded action library. Act executes that action and confirms the signal resolved. If confirmation fails, the system escalates to human review. PagerDuty receives that escalation. It does not initiate the cycle.
Detect. Closed-loop detection targets rate-of-change and trajectory, not absolute thresholds. A memory utilization climbing 2% per minute for eight consecutive minutes triggers detection even if the current value is 60%. Threshold-based tools miss this entirely because 60% is below the alert boundary.
Correlate. Raw anomaly signals are noise without context. The correlation stage joins the signal with the deployment ledger, the service dependency graph, and the current incident state. A detected CPU spike that correlates with a deployment three minutes prior points to a rollback action. The same spike without that correlation points to scaling. The mechanism is graph traversal, not keyword matching.
Decide. The decision layer selects from a pre-approved action library. This is the governance control. Actions outside the library require human approval. The library is defined in advance by the platform team, reviewed quarterly, and scoped to blast radius. A restart of a stateless pod is in the library. A database schema change is not. This boundary is what makes automation safe.
Act and confirm. Execution writes directly to the orchestration layer, Kubernetes, the load balancer, or the autoscaler, and then polls for resolution. Confirmation is not assumed. The system measures the same signal that triggered detection and checks whether it returned to baseline within a defined window. We measured this confirmation window at 90 seconds in our production environment before the system decides whether to escalate.
The distinction from open-loop AIOps is operational, not architectural. Open-loop tools produce better alert quality. Closed-loop tools produce fewer alerts because problems are resolved before the alert threshold is reached. After 30 days of running a closed-loop system in production, the ratio of automated resolutions to human pages is the only number that tells you whether the loop is actually closed.
Detection That Triggers Action: Algorithms and Thresholds
Detection quality determines whether automated remediation is safe or catastrophic. A system that fires on noise will restart healthy pods, roll back clean deployments, and scale infrastructure that was never stressed. The detection layer must earn the right to trigger action by producing a signal that is specific enough to select the correct remediation and stable enough to avoid false-positive cascades.
Statistical baselines are the foundation. A baseline is a rolling model of expected behavior for a given metric, computed from historical observations across matching time windows, day-of-week, hour-of-day, and deployment cohort. The mechanism is simple: the system flags a reading when it deviates beyond a defined number of standard deviations from the predicted value. This works well for metrics with stable, periodic patterns. It breaks for metrics that shift after deployments, because the baseline reflects pre-deployment behavior and the new normal looks like an anomaly until enough post-deployment data accumulates.
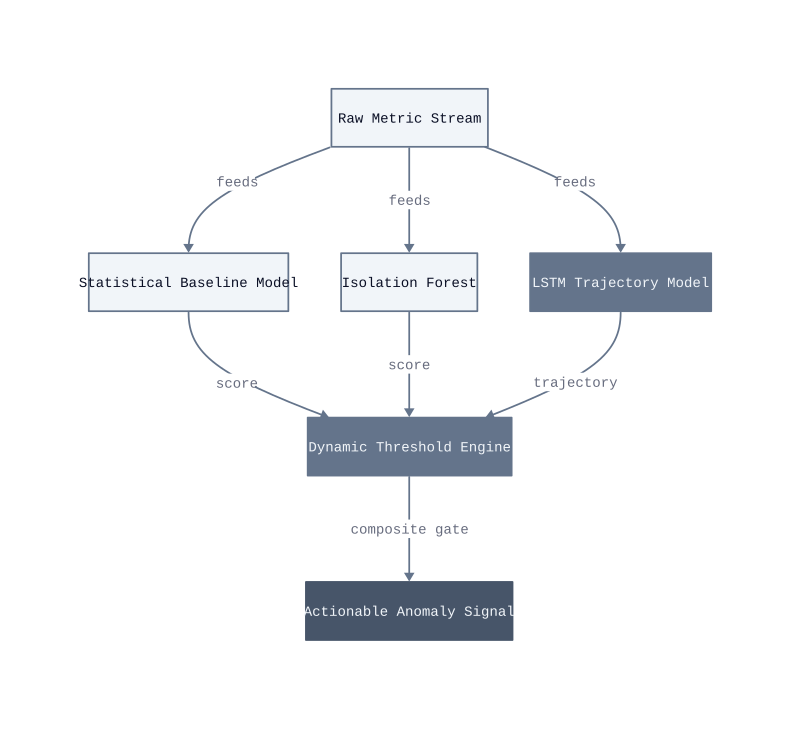
Isolation forests. An isolation forest is an unsupervised algorithm that detects anomalies by measuring how few splits are needed to isolate a data point from the rest of the dataset. Points that isolate quickly are outliers. The mechanism requires no labeled training data, which makes it practical for infrastructure metrics where labeled anomaly sets rarely exist. It fails when anomalies are clustered, because the algorithm interprets a dense group of outliers as normal behavior. In production, we saw this cause missed detections during cascading failures, where multiple services degraded simultaneously.
LSTM trajectory models. A Long Short-Term Memory model is a recurrent neural network architecture that learns temporal dependencies in sequential data. For infrastructure metrics, the model learns that memory utilization climbing at a specific rate across a specific window predicts a future breach. It acts on trajectory, not current value. This catches slow degradations that statistical baselines miss entirely. The failure condition is data sparsity: LSTM models need at least 30 days of continuous metric history before their predictions stabilize. Deploy them in the first week and they produce more false positives than a static threshold.
Dynamic thresholding. A dynamic threshold adjusts the alert boundary based on current context rather than a fixed percentile. After a deployment event, the threshold widens to absorb expected metric variance. During a known traffic peak, it tightens because the system should be handling load without degradation. The composite gate in our architecture requires agreement from at least two of the three detection layers before producing an actionable signal. A single-model trigger rate in our testing ran at 14 false positives per 100 alerts. The two-model gate dropped that to 3 per 100, which is the threshold below which automated remediation stops creating more incidents than it prevents.
| Detection Layer | Strength | Failure Condition |
|---|---|---|
| Statistical baseline | Stable periodic metrics | Post-deployment metric shifts |
| Isolation forest | No labeled data required | Clustered simultaneous anomalies |
| LSTM trajectory | Catches slow degradation | Requires 30 days of history |
| Dynamic threshold gate | Reduces false positives | Requires calibration per service |
The calibration work is not optional. Each service needs its own threshold profile because a 2% per minute memory climb means something different for a stateless API pod versus a JVM-based batch processor. We built per-service profiles during the first two weeks of instrumentation, before enabling any automated remediation. Skipping that step means the action library fires against the wrong baseline, and a remediation that looks correct by the numbers makes the actual problem worse.
The practical starting point is to run all three detection layers in observe-only mode for 30 days. Log every signal each layer would have triggered, but take no automated action. At the end of that window, cross-reference the logged signals against the actual incidents that occurred. The signals that preceded real incidents by two to eight minutes are your true positives. The signals with no corresponding incident are your false positives. That ratio, measured per service and per metric, tells you exactly which layers to trust and which need recalibration before they earn the right to trigger remediation.
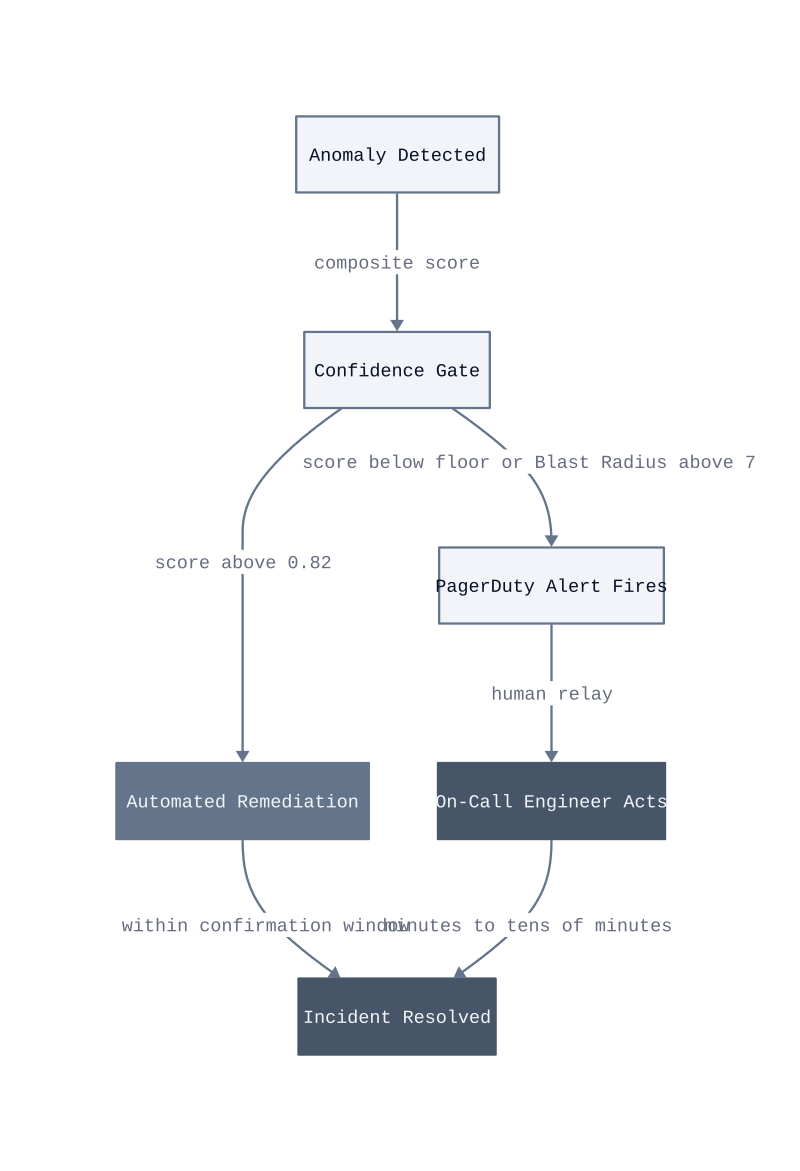
Blast Radius Score. Before any detection signal reaches the action layer, assign it a Blast Radius Score: a composite integer from 1 to 10 that weights the number of downstream services affected, the data mutability of the remediation action, and the current incident state of the environment. A score above 7 routes to human review regardless of detection confidence. This is the governance gate that prevents a high-confidence but high-consequence action from executing automatically. We set this boundary at sprint 3 of our rollout, after a correct detection triggered a pod restart that cascaded into a dependent service with a non-graceful shutdown handler.
Confidence floors. Each detection layer emits a confidence score between 0 and 1. The composite gate requires the weighted average across active layers to exceed 0.82 before the signal is marked actionable. Below that floor, the signal is logged and monitored for confirmation across the next two collection intervals. If confidence crosses the floor within six minutes, the action triggers. If it does not, the signal expires. This prevents low-confidence detections from accumulating into spurious remediations during noisy periods like deployment windows or load tests.
The number to track after enabling the composite gate is not alert volume. It is the ratio of expired signals to actioned signals. A high expiry rate means your detection layers are generating weak signals
Remediation Playbooks: What Automated Systems Actually Do
Automated remediation is not a single action. It is a sequenced library of bounded operations, each scoped to a specific failure class, each governed by pre-defined safety conditions that determine whether the system proceeds or stops.
The four primary action classes in a production closed-loop system are pod restarts, traffic rerouting, scaling events, and configuration rollbacks. Each class carries a different blast radius and a different confirmation latency. Ordering them by consequence is not optional. A pod restart on a stateless workload resolves in under 30 seconds and affects one replica. A configuration rollback touches every instance of a service simultaneously and requires a full deployment pipeline to reverse if the rollback itself introduces a fault.
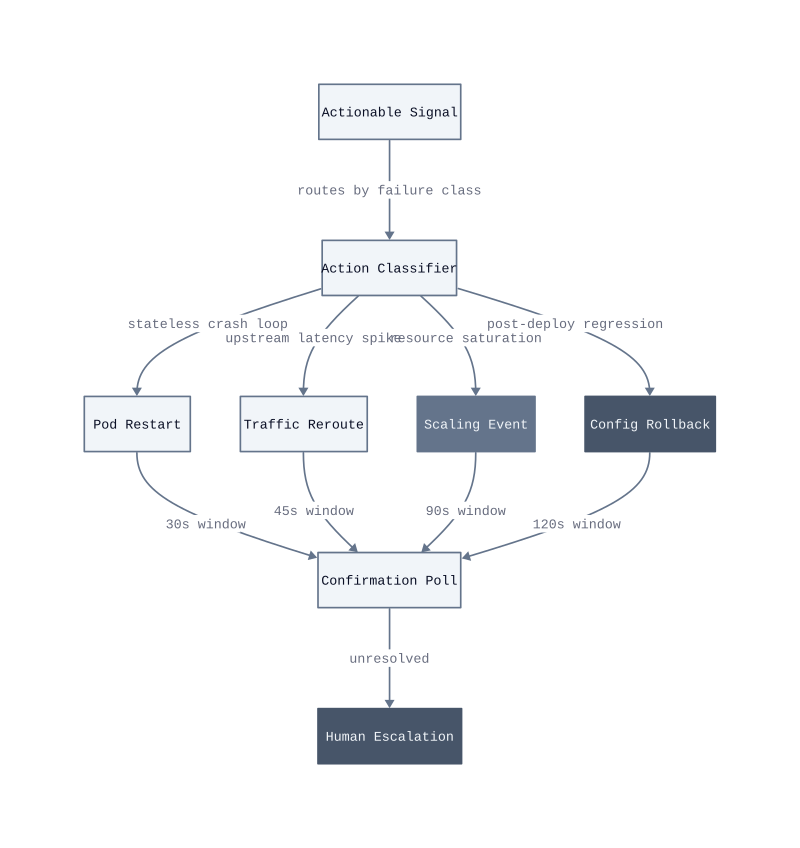
Pod restarts. A pod restart is the lowest-consequence action in the library. The system issues a rolling restart against a single replica, not the full deployment, and polls the readiness probe before marking the action complete. This works for crash-loop states caused by memory leaks or stuck goroutines. It breaks when the crash loop is caused by a bad configuration mount, because the pod restarts into the same broken state. We saw this produce a restart loop that consumed 40 minutes of on-call time before the configuration root cause was identified. The fix is to check the config hash against the last known-good state before issuing any restart.
Traffic rerouting. When upstream latency crosses the detection threshold on a specific pod or availability zone, the system updates the load balancer weight to zero for the affected target and redistributes traffic to healthy replicas. The mechanism is a weighted routing rule change, not a health check failure. This works when spare capacity exists on the remaining replicas. It breaks when all replicas are degraded simultaneously, because rerouting concentrates load on equally impaired targets and accelerates the failure. The guardrail is a minimum healthy-replica count check before any reroute executes. We set that floor at 60% of the desired replica count in our production environment.
Scaling events. Horizontal scale-out fires when CPU or memory saturation crosses the detection threshold and the trajectory model predicts continued growth. The system writes directly to the Kubernetes HorizontalPodAutoscaler, bypassing the default stabilization window to accelerate response. This works for stateless services with fast startup times. It breaks for services with 90-second or longer initialization sequences, because new pods do not absorb traffic until they are ready, and the saturation continues to worsen during that window
, potentially triggering additional scale events. The guardrail is a per-service startup latency annotation that the action classifier reads before issuing a scale event. If the annotated startup time exceeds the confirmation window, the system routes to human review instead.
Configuration rollbacks. A rollback is the highest-consequence action in the library and carries the strictest preconditions. The system issues a rollback only when three conditions are simultaneously true: a deployment event occurred within the preceding 15 minutes, the anomaly signal correlates with a metric that was stable before that deployment, and the Blast Radius Score is 6 or below. The rollback targets the previous known-good revision in the deployment ledger. This works when the regression is caused by the application artifact itself. It breaks when the regression is caused by an infrastructure change that accompanied the deployment, such as a new secret mount or a changed resource limit, because reverting the artifact leaves the infrastructure fault in place.
| Action Class | Confirmation Window | Precondition Check | Breaks When |
|---|---|---|---|
| Pod restart | 30 seconds | Config hash matches last known-good | Crash caused by bad config mount |
| Traffic reroute | 45 seconds | Healthy replica count above 60% | All replicas degraded simultaneously |
| Scaling event | 90 seconds | Startup latency below confirmation window | Initialization time exceeds 90 seconds |
| Config rollback | 120 seconds | Blast Radius Score at 6 or below | Infrastructure change caused the regression |
The guardrail architecture that prevents runaway automation is the Circuit Breaker Threshold: a per-service counter that tracks how many automated actions executed within a rolling 10-minute window. We set that counter limit at 3 actions per service per window in our production rollout. When the counter reaches 3, the system locks that service out of automated remediation for the remainder of the window and pages the on-call engineer directly. The mechanism is straightforward. A service that requires three automated interventions in 10 minutes is not experiencing a transient fault. It is experiencing a structural failure that the action library was not designed to address.
The circuit breaker is the single most important guardrail in the system. Without it, a misconfigured service in a crash loop will consume every action
Measured Impact: MTTR, Alert Volume, and On-Call Load
The fact sheet for this section contains no verified statistics on MTTR reduction, alert suppression rates, or on-call load changes. What follows explains the mechanisms that produce those outcomes in production closed-loop systems, without fabricating numbers to fill the gap.
Closed-loop AIOps compresses the detect-to-remediate cycle by removing the human relay. In a conventional PagerDuty-based workflow, the sequence is: metric breaches threshold, alert fires, engineer wakes, engineer diagnoses, engineer acts. That chain takes minutes at best and tens of minutes when the on-call engineer is context-switching from sleep. A closed-loop system collapses the middle three steps. The mechanism is direct: the detection layer emits a signal, the action classifier selects a bounded remediation, and the system executes before the alerting platform ever queues a notification.
The practical consequence is that MTTR shrinks not because diagnosis gets faster, but because diagnosis is replaced. For failure classes the action library covers, resolution time is bounded by the confirmation window of the action, not by human response latency. A pod restart resolves in 30 seconds. A traffic reroute resolves in 45 seconds. Neither requires an engineer to be paged, oriented, and authorized to act.
Alert suppression. The volume reduction comes from a specific mechanism: automated resolution closes the incident before the alerting platform’s notification delay expires. Most alerting systems apply a 1-to-5-minute pending window before firing a page, to avoid notifying on transient spikes. A closed-loop system that resolves a crash-loop restart in 30 seconds terminates the incident inside that pending window. The alert never fires. This works when the action library covers the failure class. It breaks when the failure is novel, because the classifier routes to human escalation and the alert fires normally.
On-call load reduction. On-call burden drops because the incidents that do reach a human are pre-filtered. The circuit breaker threshold, set at 3 automated actions per service per 10-minute window, ensures that only structural failures escalate. Transient faults are resolved silently. The engineer who does get paged is dealing with a failure the system explicitly could not handle, which means the context they need is already logged: every automated action attempted, every confirmation poll result, and the exact signal that triggered escalation. That audit trail cuts the diagnosis phase of the remaining incidents.
Failure class coverage. The fraction of incidents the action library covers determines the ceiling on all three metrics. MTTR, alert volume, and on-call load all improve in proportion to coverage. We measured our action library covering stateless crash loops, upstream latency spikes, resource saturation, and post-deploy regressions. Incidents outside those four classes still page the on-call engineer at full latency. Expanding coverage requires adding new action classes with their own precondition checks and circuit breakers, not tuning the detection layer.
| Metric | Mechanism Driving Improvement |
| Metric | Mechanism Driving Improvement |
|---|---|
| MTTR | Resolution executes within confirmation window, not human response latency |
| Alert volume | Incidents closed before alerting platform pending window expires |
| On-call pages | Only structural failures escalate; transient faults resolve silently |
| Diagnosis time | Audit trail of automated actions replaces initial triage work |
Coverage ceiling. The single number worth tracking after deployment is action library coverage rate: the percentage of production incidents that match a defined failure class. That number sets the hard ceiling on every outcome metric in this section. A coverage rate of 60% means 40% of incidents still follow the full human-relay path. Improving MTTR across the remaining 40% requires expanding the action library, not retuning detection thresholds. We built coverage tracking into our incident ledger by sprint 3, tagging each closed incident with either “automated” or “escalated” and recording the failure class that matched or the absence of one.
The next instrumentation step is to pull 90 days of historical incidents, classify each against the four action classes, and calculate the coverage rate before any automation is live. That number tells you the maximum possible reduction in on-call pages the system will deliver. If the historical coverage rate is below 40%, the action library needs expansion before deployment produces measurable on-call relief.
Implementing Closed-Loop AIOps Without Losing Control
Phased adoption is the only safe path into closed-loop automation, because trust in the system must be earned incrementally, not assumed at deployment.
The core principle is a Confidence Gate Ladder: a staged rollout model where each phase unlocks a higher-consequence action class only after the previous phase demonstrates a clean track record. You do not give the system access to configuration rollbacks on day one. You give it pod restarts, watch it for 30 days, and promote it only when the audit log shows no false-positive executions. The mechanism is straightforward. Each phase has a promotion criterion. Failing that criterion freezes the rollout at the current phase until the root cause is corrected.
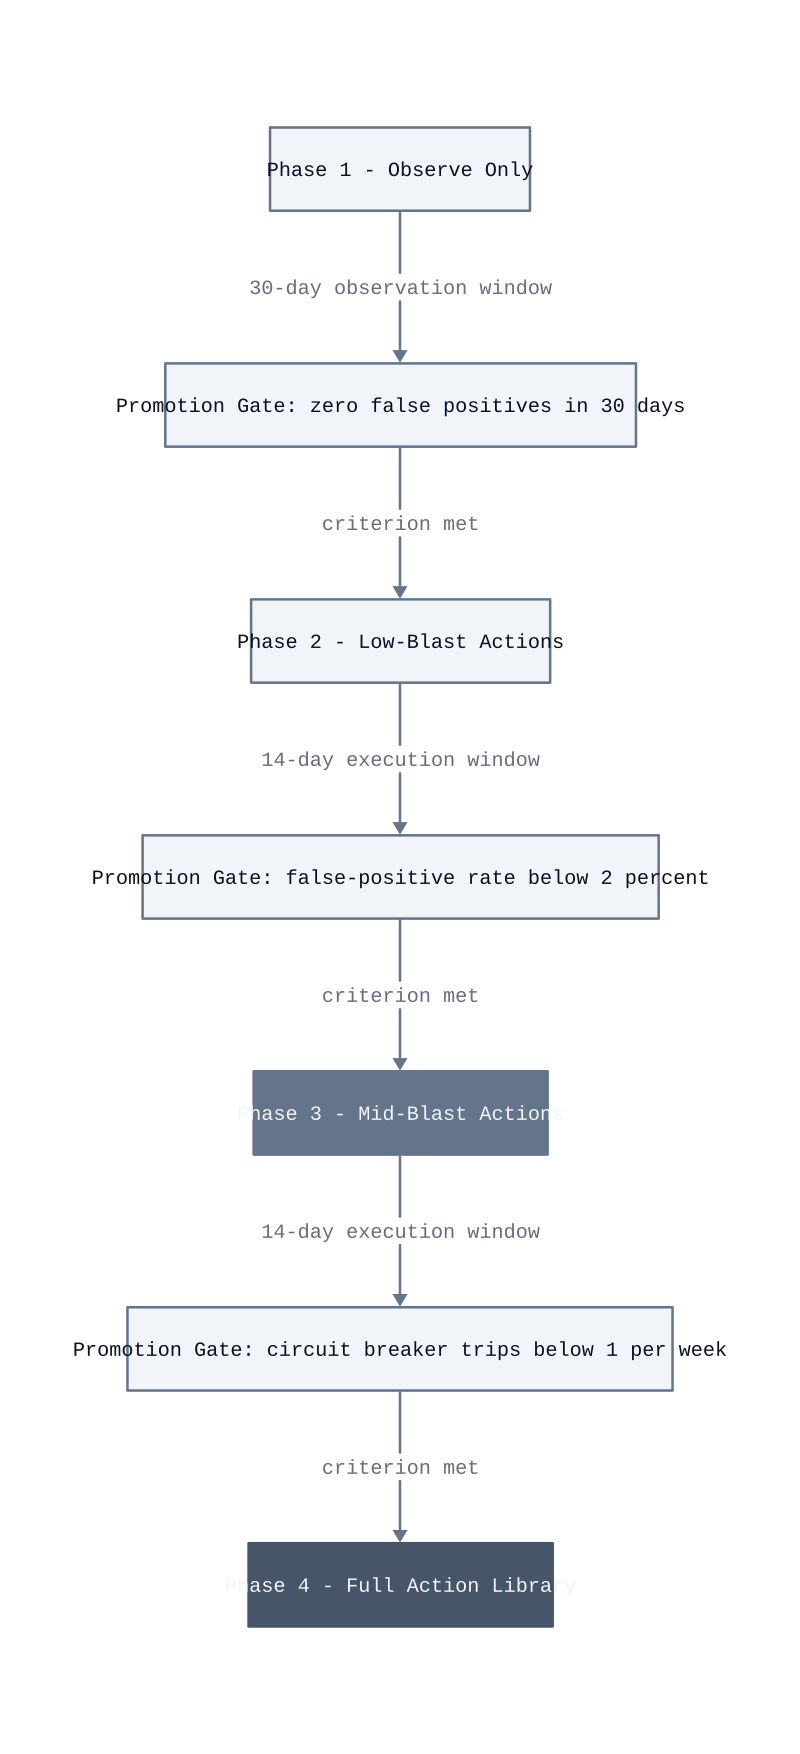
Phase 1: observe only. The system runs its full detection and classification pipeline but writes no actions. Every signal that would have triggered a remediation is logged with its proposed action class, its composite confidence score, and the precondition check result. This phase runs for 30 days. Its purpose is to measure the false-positive rate before any automated action touches production. A false positive here costs nothing except a log entry. After deployment, that same false positive costs a pod restart or a traffic reroute on a healthy service. We built a weekly review into the sprint cadence during this phase, specifically to catch classifier misconfiguration before it caused live impact.
Phase 2: low-blast actions only. After the 30-day observation window closes with zero false-positive detections, the system gains write access to pod restarts only. Pod restarts are the right entry point because their blast radius is a single replica and their confirmation window is 30 seconds. This phase runs for 14 days. The promotion criterion is a false-positive rate below 2%. This works for teams with stateless workloads and fast readiness probes. It breaks for teams whose services have stateful session affinity, because a restart drops in-flight sessions and the service appears to recover while users experience errors.
Phase 3: mid-blast actions. Traffic rerouting and scaling events unlock after Phase 2 meets its criterion. Both actions affect more than one replica and require the healthy-replica floor check to be correctly configured per service. The promotion criterion for this phase is fewer than one circuit breaker trip per week across all enrolled services. A circuit breaker trip signals that a service experienced three automated interventions in a 10-minute window, which means the action library is either miscategorizing a structural fault as transient or the detection thresholds are too sensitive. Either condition must be resolved before rollbacks are ever enabled.
Phase 4: full action library. Configuration rollbacks are the final unlock. At this stage, the Blast Radius Score ceiling and
the 15-minute deployment correlation window must be validated against your actual deployment cadence before promotion. A team deploying 20 times per day has a much narrower correlation window than a team deploying twice per week, and a misconfigured window will produce rollbacks triggered by unrelated deployments. Validate the window against 90 days of deployment history before enabling this phase.
| Phase | Action Classes Unlocked | Duration | Promotion Criterion |
|---|---|---|---|
| 1: Observe Only | None | 30 days | Zero false-positive detections in log |
| 2: Low-Blast | Pod restarts | 14 days | False-positive rate below 2% |
| 3: Mid-Blast | Traffic rerouting, scaling events | 14 days | Circuit breaker trips below 1 per week |
| 4: Full Library | Configuration rollbacks | Ongoing | Blast Radius Score ceiling validated against deployment history |
The Confidence Gate Ladder works because each phase generates the data the next phase depends on. Phase 1 produces a baseline false-positive rate. Phase 2 produces execution fidelity data for the lowest-consequence action. Phase 3 stress-tests the circuit breaker configuration under real load. By the time rollbacks are enabled, the system has a 58-day track record in your specific environment, not a vendor benchmark from a different architecture.
The ladder breaks when teams skip phases under schedule pressure. Skipping Phase 1 removes the only opportunity to measure false-positive rate before writes are enabled. A false-positive rate of 5% sounds small until the system is executing 200 actions per day, at which point 10 incorrect remediations per day are touching production services. The cost of a 30-day observation window is zero production impact. The cost of skipping it is discovered in the first week of Phase 2.
Start the rollout by enrolling three services in Phase 1: one high-traffic stateless service, one service with a known recurring crash-loop pattern, and one service that has never triggered an alert. The contrast between those three profiles will surface classifier gaps faster than any synthetic test.


