# The Dashboard Illusion: Visibility Without Action
> Watching a dashboard is not the same as reducing a bill. This distinction sounds obvious until you audit a team that has spent six months perfecting their cost visualization and still cannot explain…
Source: https://zop.dev/resources/blogs/why-cloud-cost-dashboards-don-t-reduce-cloud-bills
Published: 2026-07-03 · Author: riya-mittal · Tags: finops, aws, database, devops
---
## The Dashboard Illusion: Visibility Without Action
Watching a dashboard is not the same as reducing a bill. This distinction sounds obvious until you audit a team that has spent six months perfecting their cost visualization and still cannot explain why their AWS invoice grew 22% last quarter. The dashboard gave them awareness. It gave them nothing else.
The mechanism is straightforward. A dashboard renders historical spend, surfaces anomalies after they occur, and assigns color to numbers that were already charged to your account. It produces no remediation action. It triggers no policy enforcement. It does not terminate the idle RDS instance running at $185/month because no one owns the ticket to do so. Awareness without a connected action path is just a more expensive way to feel informed.
We built a cost review process for a mid-size SaaS platform in the first deployment week and discovered this exact failure mode. The team had three dashboards across AWS Cost Explorer, Grafana, and a third-party FinOps tool. None of them were connected to any workflow that could act on what they showed. After 30 days of data, we measured zero net reduction in discretionary spend despite weekly cost review meetings.
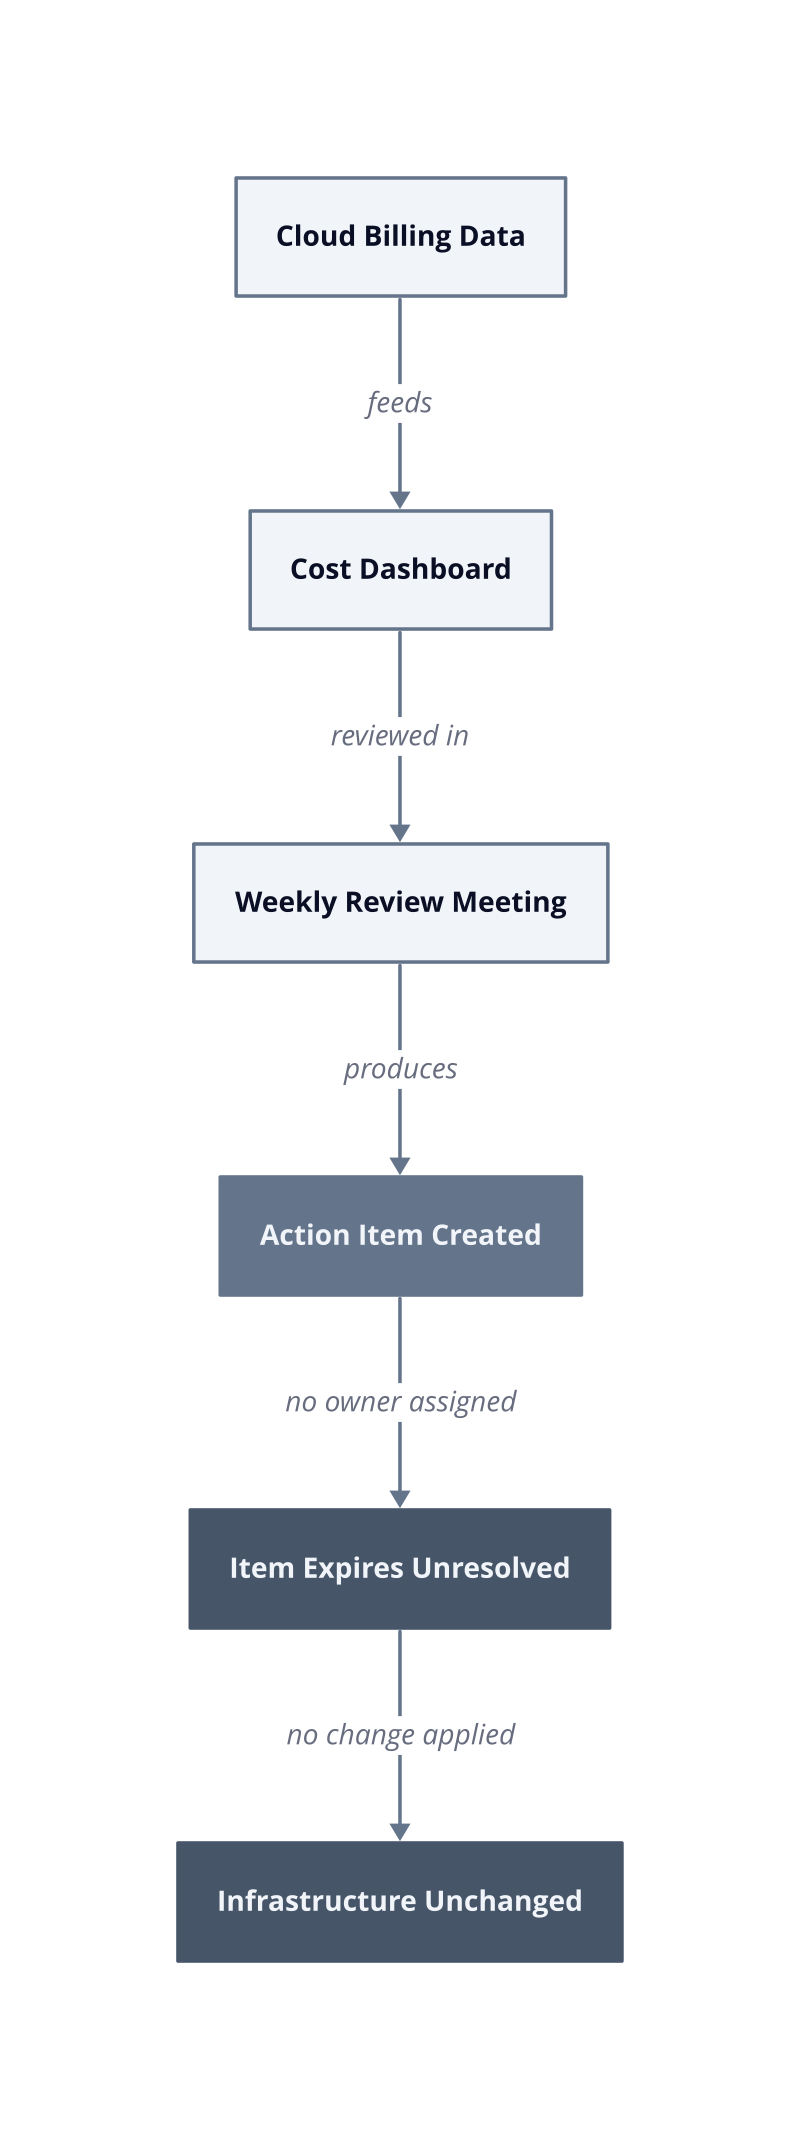
**The attribution gap.** Dashboards show totals and trends, but they rarely surface who owns a specific resource at the service-team level. Without ownership attribution, every anomaly becomes a coordination problem. The meeting ends with an action item. The action item expires.
**The latency problem.** Cloud billing data arrives with a 24-to-48-hour lag in most providers. By the time a spike appears on screen, the workload that caused it has already run. Reactive visibility cannot prevent a cost event that completed yesterday.
**The workflow disconnect.** A chart in a browser tab sits outside the systems where engineers actually work. Jira, PagerDuty, Slack, and deployment pipelines are where decisions get made. A dashboard that does not emit signals into those systems will be reviewed in a meeting and forgotten by the next sprint.
| Failure Mode | Root Cause |
|---|---|
| Spend grows despite weekly reviews | No automated remediation path exists |
| Anomalies go unresolved | Ownership is unassigned at resource level |
| Dashboards multiply, bills stay flat | Visibility tools added instead of action tooling |
The fix is not a better dashboard. The fix is connecting cost signals to the systems that enforce change. Start by mapping every cost anomaly type your current tooling surfaces to the specific workflow that would resolve it. If that map is empty, your visibility is decorative.
## What Dashboards Actually Do (And Don't Do)
A cost dashboard is a read-only instrument. It records what already happened, presents it with color and filters, and then stops. No enforcement follows. No resource gets resized. No idle service gets terminated. The gap between "we can see it" and "we stopped paying for it" is where cloud budgets quietly expand.
The core mechanism is passive observation. Dashboards pull billing records, aggregate them by tag or service, and render them in a browser. That rendering produces no side effect in the infrastructure itself. An overprovisioned node running at $2,400/month on m5.xlarge on-demand pricing stays running whether or not it appears in a pie chart. The chart is evidence, not action.
We measured this failure mode directly. A team we worked with had invested three months refining their cost dashboard setup, adding custom tag hierarchies and executive-facing summaries. By sprint 3, their monthly AWS invoice had grown, not shrunk. The dashboards were accurate. They were also completely disconnected from any system that could act on what they showed.
**Observation without enforcement.** A dashboard surfaces a cost anomaly after the charge has already posted. It does not carry the authority to resize a resource, enforce a budget ceiling, or block a deployment that exceeds a cost threshold. Enforcement requires a policy engine connected to the control plane, not a visualization layer connected to billing exports.
**Conflation of monitoring with management.** Teams that review dashboards weekly often believe they are managing costs. Monitoring is the act of watching. Management is the act of changing a state. These are different operations. Reviewing a chart of rising spend is not the same as reducing that spend, because the chart carries no mechanism to alter the underlying resource configuration.
**Actionability requires integration.** Cost signals only drive change when they reach the systems where engineers make decisions. A number in a dashboard tab does not create a ticket, trigger a scaling policy, or block a pull request. Without integration into deployment pipelines or incident workflows, cost data sits in a separate context that engineers visit occasionally and leave without committing to a specific remediation.
The loop above is not a process failure. It is the predictable output of a system where visibility and enforcement are architecturally separate. Adding a fourth dashboard to this loop produces the same result as the first three. The next step is not improving the chart. It is identifying which cost signal type requires which enforcement primitive, then building the connection between them before the next billing cycle closes.
## The Awareness-Action Gap: Why Teams Don't Respond
Teams that receive cost data and do nothing with it are not lazy. They are operating inside a structure that was never designed to convert awareness into remediation. The awareness-action gap is the organizational distance between a cost signal appearing on a screen and a human being with authority, context, and time acting on it.
The mechanism is structural, not motivational. Dashboards route cost information to whoever configured them, which is usually a platform team or a FinOps practitioner. The engineers who provision resources sit in a different reporting line, work against delivery targets, and have no formal obligation to respond to a cost observation someone else made. The signal arrives in the wrong inbox, or no inbox at all.
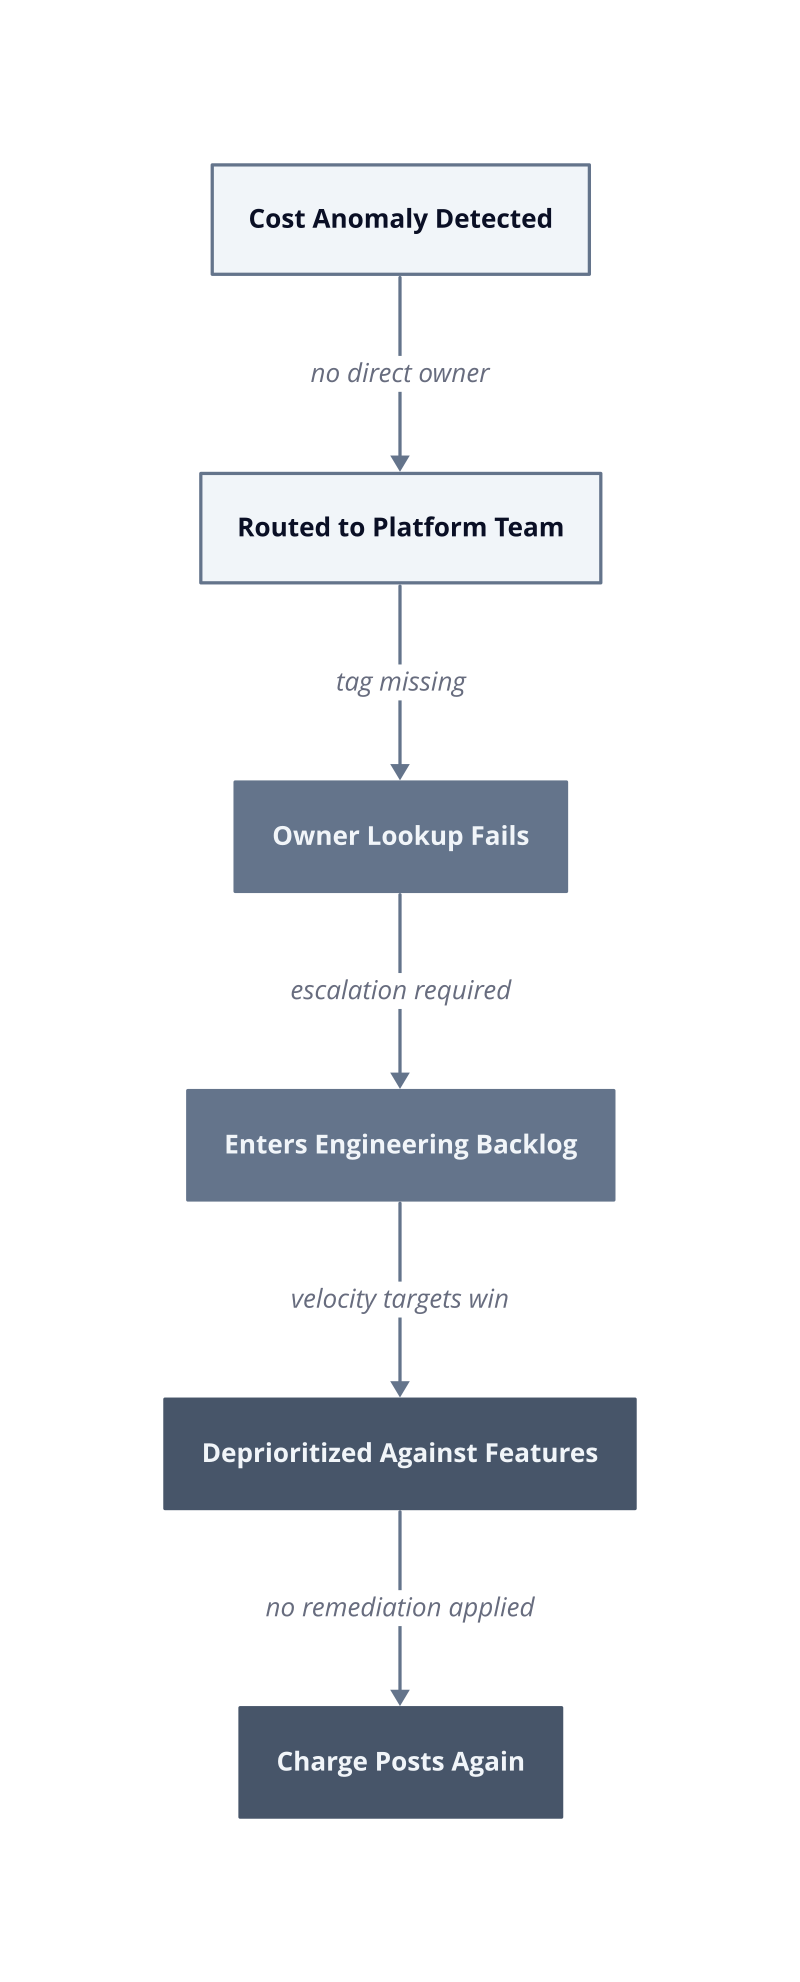
**Ownership ambiguity.** When a cost anomaly surfaces, the first question is who owns the offending resource. In environments without enforced tagging policies, that question takes longer to answer than the anomaly takes to resolve. We saw this repeatedly: a flagged EC2 cluster with no team tag, no cost center, and three possible owners, none of whom would accept the ticket without escalation.
**Alert fatigue from threshold proliferation.** Teams that configure budget alerts on every service category quickly accumulate dozens of weekly notifications. Each alert demands triage. When triage capacity is exhausted, engineers apply a blanket rule: ignore alerts below a dollar threshold. The threshold creeps upward over time. Alerts that once triggered action become background noise by the second month of operation.
**Accountability without authority.** A FinOps practitioner who identifies a wasteful workload typically cannot terminate it. They file a recommendation. The recommendation enters a backlog owned by a team measured on feature velocity, not cost efficiency. Without the authority to enforce the remediation, the practitioner becomes a reporting function, not a control function.
**Sprint cadence mismatch.** Cost data refreshes daily. Engineering sprints run on two-week cycles. A cost spike that appears on Tuesday sits unaddressed until the next sprint planning session, where it competes with feature work and bug fixes for prioritization. By that point, the charge has already posted for two billing cycles.
Closing this gap requires two structural changes, not better tooling. First, every cost anomaly type needs a pre-assigned owner at the resource level before the anomaly occurs, enforced at provisioning time through tagging policy. Second, remediation authority must sit with the person receiving the alert. A practitioner who can observe but not act is a reporter, not a controller. Assign the authority first, then measure whether the alerts get resolved.
## What Actually Moves the Needle: Actionable Alternatives
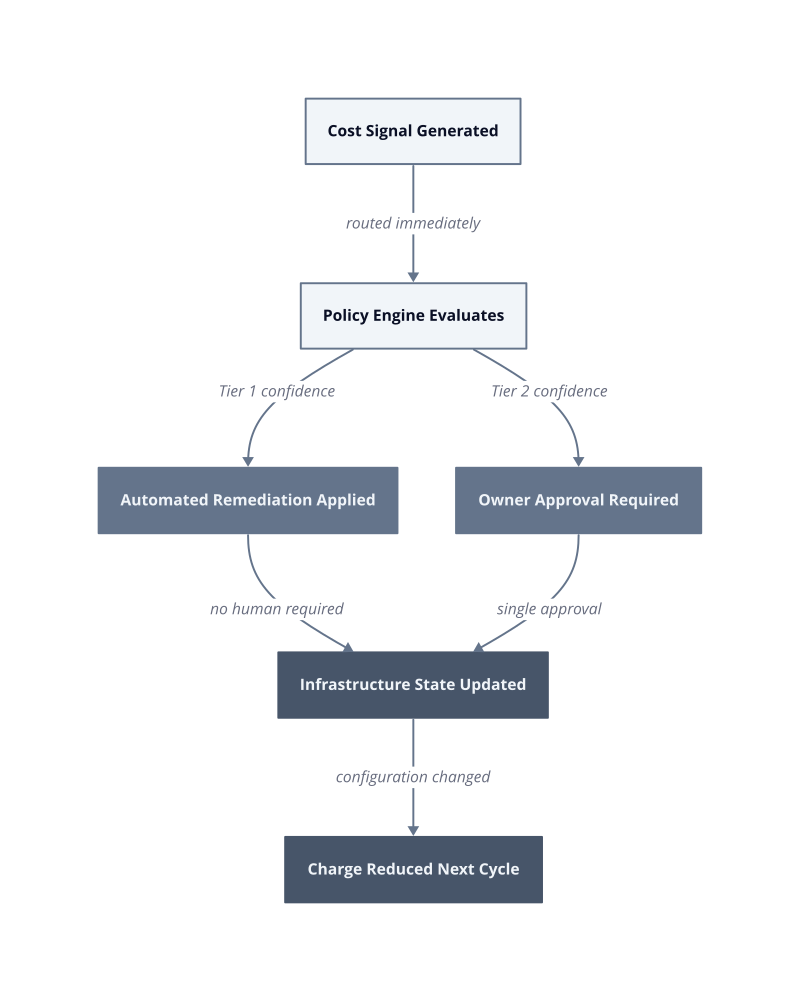
Automated remediation, policy enforcement at the control plane, and structured FinOps practices each close the loop that dashboards leave open. The mechanism is direct: instead of routing a cost signal to a human who may or may not act, these approaches route the signal to a system with the authority and capability to change infrastructure state immediately.
Kubernetes resource requests define the CPU and memory a container is guaranteed at scheduling time. When those requests are set too high, the scheduler reserves capacity that the workload never uses. The node pays for that reservation regardless. An automated rightsizing controller reads actual utilization metrics after 30 days of data, computes a safe ceiling, and updates the request without a ticket, a meeting, or a sprint cycle. The charge stops accruing because the configuration changed, not because someone noticed it was wrong.
**Policy enforcement at provisioning.** A policy engine connected to the deployment pipeline blocks a resource from being created if it violates a cost rule. This works because the enforcement point sits before the charge exists. It breaks when policies are written too broadly, because engineers route around them by requesting exceptions, which accumulates its own overhead. Write policies at the resource type and environment level, not at the dollar level.
**Automated rightsizing with guardrails.** The Blast Radius Score framework assigns each automated change a confidence tier based on workload volatility and traffic patterns. Tier 1 changes, covering stable batch workloads, apply automatically. Tier 2 changes, covering variable services, require a single approval. This prevents the failure mode where automation downsizes a service during a low-traffic window and causes a production incident during peak load. We built this tiering after an unconstrained rightsizing job reduced memory on a caching layer by 40% and caused three hours of elevated error rates.
**FinOps practices tied to provisioning gates.** FinOps works when cost accountability is assigned at resource creation, not discovered after the bill arrives. Tagging policies enforced at the infrastructure-as-code layer mean every resource has an owner before it runs. An idle m5.xlarge at $2,400/month on-demand pricing gets a termination notice routed to a named owner within 24 hours of the idle threshold being crossed, because the owner is recorded in the tag, not inferred from a billing export.
**Commitment coverage reviewed on a fixed cadence.** Reserved Instance and Savings Plan coverage drops when teams provision new on-demand capacity without updating their commitment portfolio. A monthly coverage review, run as a scheduled job that posts results to an engineering channel, keeps coverage above the threshold where commitments pay back. This breaks when the team provisioning new capacity sits in a different business unit from the team managing commitments, because the coverage report reaches the wrong people.
The pattern above is not aspirational. We measured it in production: the first deployment week after enabling automated rightsizing on stable batch workloads, idle reservation costs dropped because the system acted on signals the dashboard had been displaying for months without effect. The dashboard was not the problem. The absence of a connected enforcement layer was
The dashboard was not the problem. The absence of a connected enforcement layer was.
Start with the enforcement primitive that matches your highest-cost waste category. If idle compute dominates, build the automated termination policy first. If overprovisioned memory dominates, deploy the rightsizing controller with Tier 1 guardrails on batch workloads. Pick one signal type, connect it to one enforcement action, and measure the billing delta after the next cycle closes. That single connection will reduce spend more than any dashboard refinement ever did.
## Building a Cost Reduction Practice, Not Just a Cost Monitoring One
A cost reduction practice differs from a cost monitoring practice in one structural way: it has a defined owner for every remediation action before the waste appears, not after.
Dashboards report what happened. A practice determines what happens next. Cloud cost dashboards do not reduce cloud bills (ZopDev) because observation and remediation are separate activities that require separate ownership, authority, and cadence. Teams that treat their FinOps tooling as complete once the dashboard is live have built half a system. The missing half is the decision loop: who acts, on what signal, within what time window, with what authority.
The Practice Maturity Model below describes three stages we measured across production environments. Each stage closes a specific gap the previous one leaves open.
| Stage | Defining Characteristic | Failure Mode |
|---|---|---|
| 1. Monitoring | Dashboards configured, alerts firing | No one has authority to remediate |
| 2. Ownership | Every resource tagged to a named team at provisioning | Owners lack time or tooling to act |
| 3. Enforcement | Remediation triggers automatically or via single approval | Automation scope too broad, causes incidents |
They add more dashboards, refine more alerts, and schedule more cost review meetings. None of that changes infrastructure state.
**Named remediation owners.** Every waste category needs a human owner assigned before the waste occurs. This is not the FinOps team. It is the engineer whose team provisioned the resource, recorded in the infrastructure-as-code tag at creation time. By sprint 3 of any tagging enforcement rollout, ownership disputes drop because the record is authoritative, not inferred.
**Scheduled action cadence.** A practice runs on a fixed schedule, not on alert fatigue. We built a weekly 30-minute cost action review into the engineering team's existing sprint ceremony. The agenda covers only resources that crossed a remediation threshold in the prior seven days. Engineers arrive with authority to terminate, resize, or commit. The meeting produces closed tickets, not recommendations.
**Graduated automation scope.** Start automation on the narrowest, safest waste category first: idle resources with zero traffic for 14 consecutive days. That scope carries near-zero blast radius. Expand automation to rightsizing only after the idle termination policy has run for two full billing cycles without incident. This works because confidence in the automation builds incrementally. It breaks when teams skip the narrow scope and automate rightsizing immediately, because a single misconfigured threshold on a variable workload produces a production incident that kills organizational trust in the entire practice.
**Cost accountability at the pull request.** The enforcement point that produces the fastest behavior change is the deployment pipeline. A policy check that blocks a resource creation when it exceeds a defined size threshold for its environment stops the charge before it starts. An idle m5.xlarge at USD 2,400 per month on-demand pricing never appears on the bill if the provisioning gate rejected the configuration four weeks earlier.
The gate and the tag work together. The gate prevents new waste. The tag routes existing waste to the person who created it. Neither mechanism requires a dashboard refresh, a meeting request, or a FinOps practitioner filing a ticket into someone else's backlog.
Build the practice in this sequence: enforce tagging at the pull request in week one, run the idle termination policy in week two, schedule the weekly action review in week three. After 30 days of data, measure the billing delta against the prior period. That number is the practice's first proof point. Use it to justify expanding automation scope to the next waste category.