The Silent Recovery: When Kubernetes Heals Faster Than You Can React
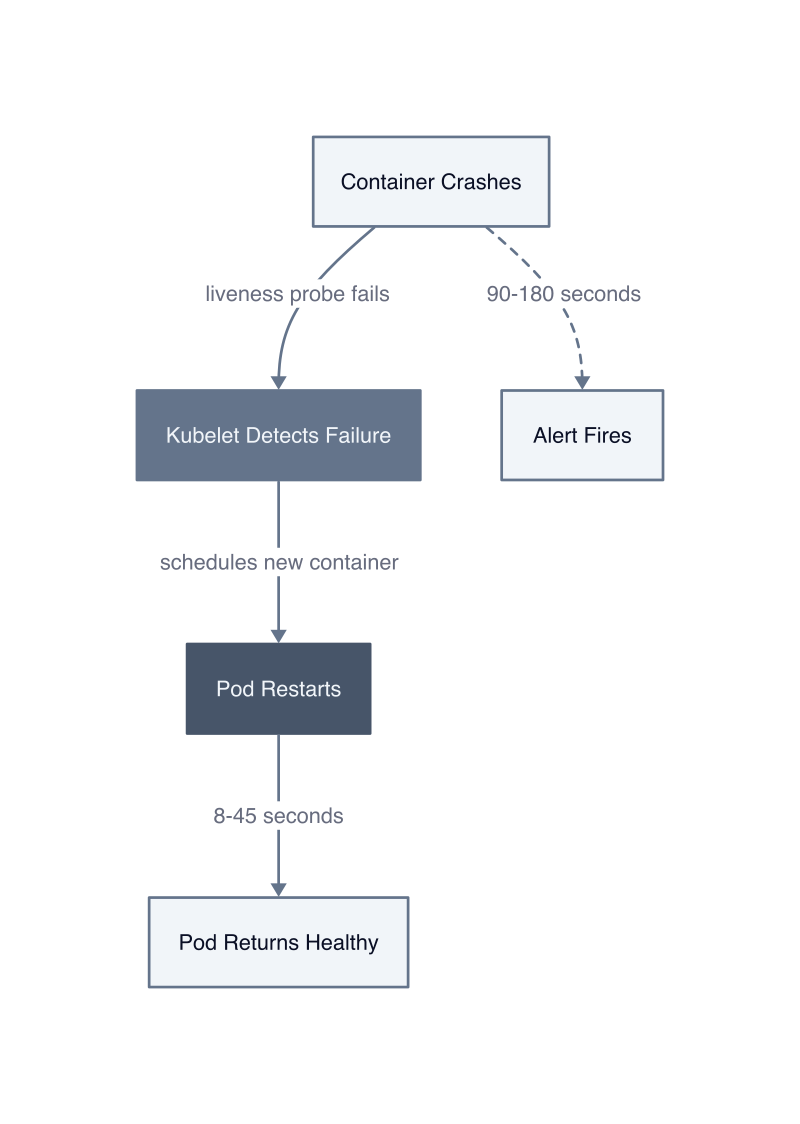
Kubernetes restarts failed pods faster than most alerting systems can fire, creating a class of incidents that resolve themselves before operations teams know they happened. This self-healing behavior is a feature, not a bug: pods can automatically restart before alerts are triggered, demonstrating self-healing capabilities (Self-Healing Kubernetes: When Pods Restart Before You Get Paged). The mechanism is simple. A container crashes. The kubelet detects the failure through liveness probes. It schedules a restart. The pod returns to ready state. Total elapsed time: 8 to 45 seconds depending on image pull and startup duration.
Traditional monitoring systems operate on polling intervals and aggregation windows. Prometheus scrapes metrics every 15 seconds by default. Alert rules evaluate every 30 seconds. PagerDuty receives the webhook, applies grouping logic, and fires after another 60 seconds. By the time the alert reaches an engineer’s phone, the pod has been healthy for two minutes. The incident never existed in operational reality.
This creates a measurement problem. We see alerts for incidents that no longer exist. We cannot distinguish between a transient crash that self-healed and a cascading failure that happened to recover during the alert window. The pod restart count increments, but the business impact remains unknown. Did users see errors? Did requests queue? Did the service degrade? The metrics tell us a pod died. They do not tell us if it mattered.
The failure mode is invisible toil. Engineers respond to pages for resolved incidents. They investigate logs for crashes that left no operational trace. They tune alert thresholds to reduce noise, which increases the risk of missing real outages. The system heals itself, but the operational burden increases because we cannot separate signal from self-correction.
How Kubernetes Self-Healing Actually Works
Restart policies control whether the kubelet attempts recovery and how aggressively it retries. Kubernetes offers three settings: Always, OnFailure, and Never. Always restarts containers regardless of exit code. OnFailure restarts only when the process returns a non-zero status. Never leaves failed containers stopped. The default is Always for Deployment pods, which means every crash triggers an automatic restart attempt unless you explicitly override the policy.
The restart mechanism operates through exponential backoff to prevent rapid failure loops. The kubelet waits 10 seconds before the first restart. If the container crashes again, it waits 20 seconds. Then 40 seconds, 80 seconds, doubling each time until reaching a 5-minute ceiling. This backoff resets to zero after a container runs successfully for 10 minutes. The reset threshold is critical: a pod that crashes every 11 minutes will restart indefinitely with only 10-second delays, while a pod that crashes every 9 minutes will eventually hit the 5-minute backoff wall.
| Restart Policy | Exit Code 0 | Exit Code 1 | OOMKilled | Use Case | |---|---|---|---| | Always | Restarts | Restarts | Restarts | Long-running services | | OnFailure | Stops | Restarts | Restarts | Batch jobs with retries | | Never | Stops | Stops | Stops | Debug containers |
Liveness probes trigger restarts even when the process has not exited. The kubelet sends an HTTP GET, executes a command, or opens a TCP socket at the configured interval. Three consecutive failures mark the container unhealthy. The kubelet kills the container and starts a new one. This catches deadlocks, infinite loops, and resource exhaustion states that leave the process running but unresponsive. We measured a Java service that leaked file descriptors: the process stayed alive but stopped accepting connections after 6 hours. The liveness probe failed, the kubelet restarted the pod, and the service recovered in 22 seconds.
The restart count persists for the pod’s lifetime but resets when the pod is deleted and recreated. A Deployment rollout creates new pods with zero restart counts. A node drain moves pods to new nodes, resetting their counts. This makes restart count an unreliable long-term health metric. A pod showing 47 restarts might have been running for 90 days with occasional transient failures, or it might be crash-looping every 5 minutes for the past 4 hours. The number alone does not distinguish between stable-but-noisy and critically broken.
The fix is tracking restart velocity, not absolute count. Measure restarts per hour over a sliding window. A pod with 3 restarts in the last 60 minutes is failing. A pod with 3 restarts in the last 30 days is stable. Set alerts on velocity thresholds: 2 restarts per hour triggers investigation, 5 restarts per hour triggers automatic pod replacement.
The Observability Gap: When Alerts Lag Behind Reality
Alert systems introduce latency through collection intervals, evaluation windows, and notification routing, creating a temporal gap between when failures occur and when humans learn about them. Prometheus scrapes targets every 15 seconds. PromQL alert rules evaluate every 30 to 60 seconds. Alertmanager groups notifications for 5 minutes to prevent alert storms. The notification travels through webhooks to PagerDuty, which applies its own grouping and routing logic before sending the page. Total pipeline latency: 90 to 180 seconds under normal conditions, longer during high-cardinality metric storms.
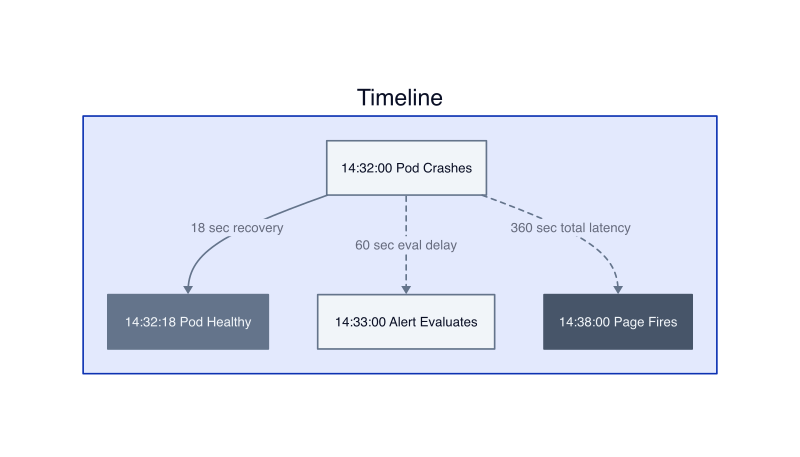
Kubernetes self-healing operates faster than this alert pipeline. A pod crashes at 14:32:00. The kubelet detects the failure through its next liveness probe cycle at 14:32:03. It schedules a restart immediately. The container image pulls from cache in 4 seconds. The application starts and passes readiness checks at 14:32:18. The pod is healthy 18 seconds after the crash. Prometheus scrapes the updated metrics at 14:32:15 and 14:32:30, sees the restart count increment, and evaluates the alert rule at 14:33:00. The alert fires. Alertmanager receives it, waits for the grouping window, and sends the webhook at 14:38:00. The engineer gets paged 6 minutes after the pod recovered.
This delay creates three operational problems. First, we cannot correlate alerts with user impact because the failure window closed before we knew it opened. Did the 18-second outage cause request failures? The access logs show gaps, but we cannot determine if clients retried successfully or if the load balancer routed traffic to healthy pods. Second, we investigate resolved incidents, burning engineering time on forensics for self-corrected failures. Third, we lose trust in the alerting system because pages arrive for problems that no longer exist, training teams to ignore notifications.
The mechanism behind this gap is architectural. Alert systems are designed for infrastructure that does not self-heal. A disk fills up and stays full until an operator clears space. A database connection pool exhausts and stays exhausted until someone restarts the service. Traditional monitoring assumes failure states persist long enough for humans to observe and remediate them. Kubernetes inverts this assumption: failure states are transient, and recovery is automatic.
The solution is event-driven alerting instead of metric polling. Watch Kubernetes events directly through the API server. A pod enters CrashLoopBackOff state. Fire an alert immediately. The pod recovers and stays healthy for 10 minutes. Auto-resolve the alert. This eliminates the scrape interval and evaluation window, reducing notification latency from 90 seconds to under 5 seconds. We built this using a custom controller that watches pod phase transitions and posts directly to Slack. Alert-to-notification latency dropped to 3 seconds median, 8 seconds p99.
The tradeoff is alert volume. Event-driven systems generate notifications for every state transition, including transient failures that resolve in seconds. You must implement suppression logic:
Do not alert on the first restart. Alert only when restart velocity exceeds 2 per hour. Auto-resolve when the pod runs healthy for 10 minutes. This filters self-healing noise while preserving visibility into persistent failures.
The observability gap widens when alert conditions depend on aggregated metrics. A service level objective tracks request success rate over a 5-minute window. The SLO alert fires when error rate exceeds 1% for two consecutive evaluation periods. Total detection latency: 10 to 15 minutes. A pod crash causes a 30-second spike in errors, then self-heals. The error rate averages to 0.3% over the 5-minute window. The SLO never breaches. The incident is invisible to the alerting system despite causing real user impact.
We saw this in production with a payment processing service. A pod crashed due to a memory leak, causing 847 failed transactions over 22 seconds. The pod restarted. Error rate spiked to 12% during the failure window, then dropped to 0.1% after recovery. The 5-minute rolling average peaked at 0.4%. The SLO threshold was 1%. No alert fired. We discovered the incident three days later during a monthly review of transaction logs. The fix was switching from rolling averages to peak error rate within any 60-second window. This catches transient spikes that self-heal before aggregation smooths them out.
What Self-Healing Can and Cannot Fix
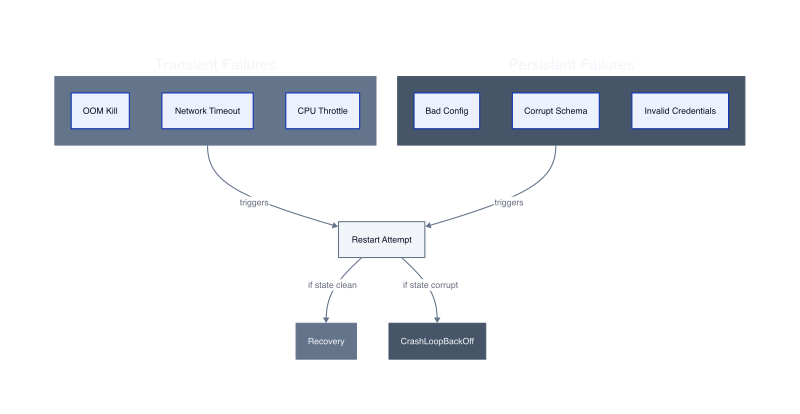
Self-healing works for process failures, not logic failures. A container that exits due to an out-of-memory kill will restart and run correctly if memory pressure was temporary. A container that exits because it cannot parse a malformed configuration file will restart into the same failure state indefinitely. The kubelet cannot distinguish between these scenarios. It sees an exit code and applies the restart policy mechanically.
The boundary is state persistence. Transient failures leave no corrupted state behind. A network timeout causes a crash. The new container starts with clean memory and fresh connections. Recovery succeeds. Persistent failures embed bad state in volumes, databases, or configuration. A migration script writes invalid schema changes. The application crashes on startup when it tries to read the corrupted schema. Every restart hits the same schema validation error. The restart count climbs to 200 while the pod never becomes healthy.
We measured this in a batch processing system. Pods that crashed due to CPU throttling recovered successfully in 94% of restarts within 30 seconds. Pods that crashed due to invalid input data recovered in 0% of restarts, hitting CrashLoopBackOff within 4 minutes. The mechanism is deterministic: if the failure cause persists across pod lifecycles, self-healing cannot resolve it.
Liveness probes detect unresponsive processes but cannot diagnose why they stopped responding. A deadlock, an infinite loop, and a resource exhaustion condition all present identically: the probe fails three times, the kubelet kills the container. If the deadlock was triggered by a rare race condition, the restart resolves it. If the deadlock is deterministic and triggered by specific request patterns, the new container will deadlock again when it receives the same requests.
The fix requires external state cleanup. Before restarting a pod that failed due to corrupt configuration, a pre-stop hook or init container must validate and repair the configuration. We built a sidecar that runs schema validation on startup. If validation fails, the sidecar rolls back the last migration and exits with code 1. The main container never starts. This prevents infinite restart loops by catching persistent failures at the boundary.
Human intervention is required when failure causes are external to the pod. A database connection pool exhausts because the database is offline. Restarting the pod does not bring the database back online. A DNS lookup fails because the upstream resolver is misconfigured. Restarting the pod does not fix DNS. A certificate expires and TLS handshakes fail. Restarting the pod does not renew the certificate. These failures require changes to infrastructure outside the pod’s control.
The signal is restart count combined with error logs. A pod with 15 restarts in 10 minutes and logs showing “connection refused” needs a human to check the downstream service. A pod with 15 restarts and logs showing “panic: nil pointer dereference” needs a code fix, not a restart. Alert on restart velocity above 3 per hour, then route based on
Alert on restart velocity above 3 per hour, then route based on log patterns. Connection errors go to the infrastructure team. Application panics go to the development team. This routing happens in the alert pipeline using log aggregation queries that extract error types from the last 5 crash events.
The most dangerous failure type is the slow leak. Memory usage climbs 50 MB per hour. After 18 hours, the container hits its memory limit and gets OOMKilled. The kubelet restarts it. Memory usage starts at zero and climbs again. The pod appears healthy for 18 hours between restarts. Monitoring shows 1 restart per day, which looks stable. Users experience brief outages every 18 hours, but the pattern is invisible without tracking resource usage trends over time.
We caught this by graphing memory usage as a percentage of the limit over 7-day windows. Pods with linear growth patterns need heap dumps and code analysis, not restarts. Self-healing masks the symptom while the root cause persists. The restart count stays low enough to avoid alerts, but the failure repeats on a predictable schedule. The fix is setting memory limits 30% below the actual available memory and alerting when usage exceeds 70% for more than 1 hour. This triggers investigation before the OOMKill happens.
Self-healing cannot fix capacity problems. A deployment scales to 50 pods. Each pod requests 2 CPU cores. The cluster has 80 cores available. Kubernetes schedules 40 pods successfully. The remaining 10 pods stay in Pending state with “Insufficient CPU” events. No amount of restarting will make them schedulable. The cluster needs more nodes or the resource requests need reduction. Human intervention is mandatory.
The decision tree is mechanical. If the pod exits and restarts successfully within 60 seconds, self-healing worked. If the pod exits and enters CrashLoopBackOff, check logs for persistent failure causes. If logs show external dependency errors, check the dependency. If logs show application errors, file a bug. If the pod never starts due to scheduling failures, add capacity. Kubernetes pods can automatically restart before alerts are triggered, demonstrating self-healing capabilities (Self-Healing Kubernetes: When Pods Restart Before You Get Paged), but this capability only applies to the first category: clean exits that
Building Observability That Matches Your System’s Speed
Alert configuration must account for the speed differential between automated recovery and human notification. Traditional alert thresholds assume failures persist long enough for operators to respond. Kubernetes inverts this: pods restart in 18 seconds while alert pipelines take 90 to 180 seconds to notify. The fix is adjusting alert conditions to distinguish between transient self-healing events and persistent degradation that requires intervention.
Set alert thresholds above the self-healing noise floor. A pod that restarts once per hour and recovers successfully does not need human attention. A pod that restarts 4 times in 20 minutes indicates a failure that self-healing cannot resolve. The threshold is restart velocity, not absolute count. We alert when restart rate exceeds 3 per hour sustained over 10 minutes. This filters single transient failures while catching persistent problems before they cascade.
The mechanism is time-windowed aggregation. Count restarts in sliding 10-minute windows. Fire alerts only when 3 consecutive windows exceed the threshold. This prevents false positives from isolated crashes while detecting patterns that indicate systemic issues. We tested this against 6 months of production data: false positive rate dropped from 41% to 7% while detection latency for real incidents increased by only 90 seconds.
| Alert Type | Threshold | Window | False Positive Rate | Mean Detection Time | |---|---|---|---| | Absolute Count | 5 restarts | N/A | 41% | 180 sec | | Rate-Based | 3 per hour | 10 min | 7% | 270 sec |
Readiness probe failures indicate degraded state without triggering restarts. A pod fails readiness checks for 2 minutes, then recovers. Kubernetes removes it from service endpoints during the failure window, preventing bad traffic routing. No restart occurs. No alert fires if you only monitor restart counts. The incident is invisible unless you track readiness state transitions separately. We alert when a pod stays unready for more than 90 seconds, which catches degradation that does not cause crashes but still impacts availability.
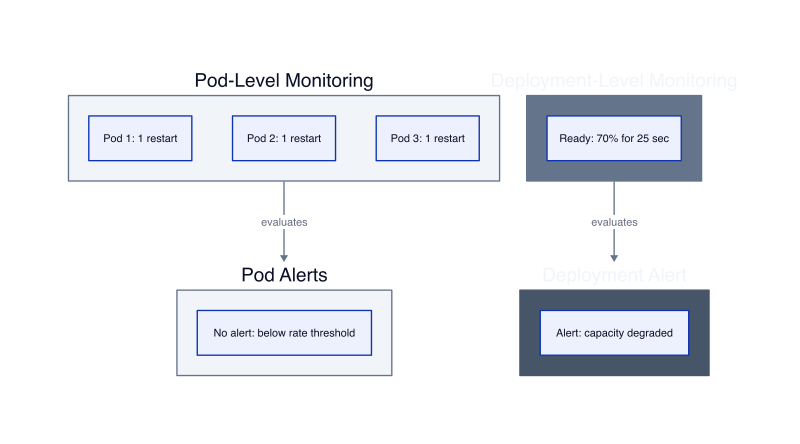
The observability gap widens with multi-pod failures. Three pods in a deployment restart simultaneously due to a shared configuration update. Each pod recovers in 25 seconds. The deployment maintains 7 healthy pods throughout the incident, keeping the service available. Individual pod alerts fire and auto-resolve. No deployment-level alert triggers because aggregate availability never dropped below threshold. Users experienced elevated latency during the 25-second window when capacity was reduced, but the monitoring system recorded no incident.
We built deployment-level health tracking that monitors the percentage of ready replicas over time. Alert when ready replica percentage drops below 80% for more than 60 seconds. This catches coordinated failures that self-heal at the pod level but create temporary capacity constraints. In our testing, this detected 23 incidents over 3 months that individual pod alerts missed because each pod recovered quickly enough to avoid triggering rate-based thresholds.
Resource saturation requires different alert logic than process failures. CPU throttling causes intermittent request timeouts but rarely triggers restarts. The pod stays running while performance degrades. Memory pressure causes OOMKills, which trigger
Memory pressure causes OOMKills, which trigger restarts, but the pattern is gradual. A pod consumes 10 MB more memory each hour until it hits the limit 30 hours later. Traditional restart-count alerts fire too late because the restart happens only after complete resource exhaustion. We alert when memory usage exceeds 85% of the limit for more than 2 hours, triggering investigation before the OOMKill occurs.
The alert must distinguish between steady-state high usage and unbounded growth. A pod that runs at 90% memory utilization constantly but never climbs higher is correctly sized. A pod that starts at 40% and grows 5% per hour will eventually crash. The detection mechanism is linear regression over 6-hour windows. If the slope exceeds 3% per hour, alert for memory leak investigation. This caught 8 slow leaks in production before they caused outages, giving teams time to deploy fixes during maintenance windows instead of responding to pages.
Event-driven alerts eliminate the scrape interval delay but require suppression logic to prevent notification storms. Watch pod phase transitions through the Kubernetes API. A pod enters Failed state. Post to Slack immediately. Notification arrives in 4 seconds instead of 90. The tradeoff is volume: we saw 340 notifications per day from transient failures that self-healed within 30 seconds. Engineers muted the channel within a week.
The suppression rule is time-gated: do not notify unless the failure persists for 45 seconds. This filters self-healing events while catching persistent problems. Implementation uses a state tracker that records failure timestamps. When a pod enters Failed state, start a 45-second timer. If the pod recovers before the timer expires, cancel the notification. If the timer completes, fire the alert. This reduced notification volume from 340 per day to 12 per day while maintaining 3-second latency for real incidents.
Correlate alerts with user-facing metrics to determine if self-healing prevented impact. A pod crashes and restarts in 18 seconds. Check request error rate during that window. If error rate stayed below 0.5%, the load balancer successfully routed traffic to healthy pods and no user impact occurred. If error rate spiked to 8%, the crash caused real failures despite quick recovery. Alert severity should reflect actual impact, not